
.png)
物件说明
- iU91编号 147172
- 发布人 地产经纪
特色说明
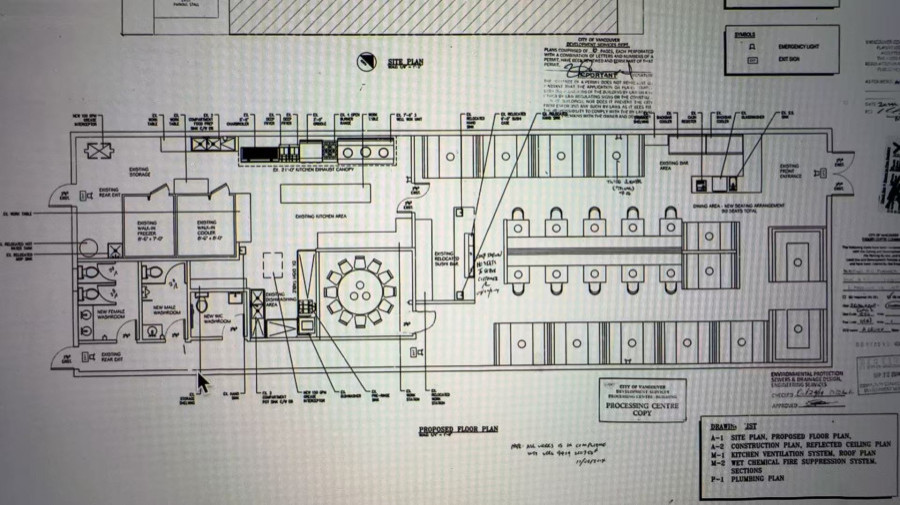
*仅限预约参观,请勿打扰工作人员*温哥华Robson街优质餐厅转让机会!餐厅位于城市最繁华的餐饮街区之一,周边环绕零售商铺、酒店及多个热门景点,曝光度高,人流量稳定。餐厅面积约3,432平方英尺,可容纳约100位客人,适合团体用餐及高营业额经营模式。用餐区配备23个内置餐桌排风系统,非常适合火锅、烧烤或各类明火餐饮业态。酒牌营业时间至凌晨2点,为拓展夜间营业带来极大潜力。店铺配备完善的商业级厨房设施,包括20英尺排烟罩、步入式冷藏库及冷冻库,可支持多种餐饮概念直接运营。这是一个难得的“拎包营业”机会,适合希望在温哥华核心黄金地段开展或扩展餐饮业务的买家。详情请联系挂牌经纪获取更多信息。
*Showing by appointment only, do not disturb staff. *
Prime restaurant opportunity on Vancouver’s vibrant Robson Street! Located in one of the city’s busiest dining corridors, the property is surrounded by retail, hotels, and major attractions, ensuring strong exposure and consistent customer traffic.
This spacious 3,432 sq.ft. restaurant offers seating for up to 100 guests, making it ideal for both group dining and high-volume operations. The dining area features 23 built-in table exhaust systems, perfectly suited for hot pot, BBQ, or grill-style concepts. A liquor license valid until 2:00 AM adds excellent potential for late-night revenue.
The restaurant is fully equipped with a commercial-grade kitchen, including a 20-foot exhaust hood, walk-in cooler, and walk-in freezer, ready to support a wide range of food concepts.
This is a rare turnkey opportunity to establish or expand your restaurant in one of Vancouver’s most sought-after and dynamic locations.
Please contact the listing agent for more information.
地图周边
社区结构2021年人口统计数据
人口统计
| 总计 | 男性 | 女性 | |
| 2021年该地区人口数量 | 5,126 | ... | ... |
|---|---|---|---|
| 2016年该地区人口数量 | 4,773 | ... | ... |
| 2006年到2011年该地区人口变化率 | 7.4 | ... | ... |
| 个人住宅数量 | 3,177 | ... | ... |
| 正常使用的个人住宅数量 | 2,799 | ... | ... |
| 每平方公里人口密度 | 23,215.6 | ... | ... |
| 该地区土地面积(平方公里) | 0.22 | ... | ... |
房价租金统计
| 总计 | 男性 | 女性 | |
| 平均房价 ($) | 1,916,000 | ... | ... |
|---|---|---|---|
| 养房开销(包括税,贷款,水电煤,管理费) ($) | 2,536 | ... | ... |
| 有房屋贷款的居民比例 (%) | 37.8 | ... | ... |
| 租房开销(包括租金,水电煤,服务费) ($) | 2,324 | ... | ... |
| 独立房 | 10 | ... | ... |
| 公寓(5层以上大楼) | 2,565 | ... | ... |
| 半独立屋 | 0 | ... | ... |
| 排屋 | 55 | ... | ... |
| Duplex里的公寓 | 0 | ... | ... |
| 公寓(4层以下大楼) | 170 | ... | ... |
| 其他独立住宅 | 5 | ... | ... |
| 临时房 | 0 | ... | ... |
收入统计
| 总计 | 男性 | 女性 | |
| 2020年家庭平均收入 | 175,200 | ... | ... |
|---|---|---|---|
| 2020年家庭平均税后收入 | 130,000 | ... | ... |
| 家庭平均人口 | 2.5 | ... | ... |
| 2020年无子女的家庭平均收入 | 193,200 | ... | ... |
| 2020年无子女的家庭平均税后收入 | 139,600 | ... | ... |
| 无子女的家庭平均人口 | 2.0 | ... | ... |
| 2020年有子女家庭平均收入 | 181,000 | ... | ... |
| 2020年有子女家庭平均税后收入 | 138,500 | ... | ... |
| 有子女家庭平均人口 | 3.6 | ... | ... |
| 2020年单亲家庭平均收入 | 71,000 | ... | ... |
| 2020年单亲家庭平均税后收入 | 63,000 | ... | ... |
| 单亲家庭平均人口 | 2.3 | ... | ... |
语言统计
| 总计 | 男性 | 女性 | |
| 只说英语的人数 | 4,490 | 2,230 | 2,260 |
|---|---|---|---|
| 只说法语的人数 | 5 | 0 | 0 |
| 可以说英法语的人数 | 470 | 205 | 260 |
| 不懂法语和英语的人数 | 160 | 60 | 100 |
族裔统计
| 总计 | 男性 | 女性 | |
| 南亚人 | 255 | 125 | 130 |
|---|---|---|---|
| 中国人 | 790 | 355 | 435 |
| 黑人 | 65 | 45 | 25 |
| 菲律宾人 | 90 | 20 | 65 |
| 阿拉伯人 | 55 | 40 | 20 |
| 拉丁美洲人 | 295 | 135 | 165 |
| 东南亚人 | 60 | 15 | 40 |
| 西亚人 | 625 | 305 | 315 |
| 韩国人 | 300 | 95 | 205 |
| 日本人 | 120 | 55 | 65 |
| 其他民族 | 25 | 15 | 10 |
| 属于多个民族的后裔 | 85 | 30 | 55 |
| 非少数民族 | 2,300 | 1,265 | 1,035 |
职业统计
| 总计 | 男性 | 女性 | |
| 立法和高级管理职位 | 95 | 65 | 25 |
|---|---|---|---|
| 商业,金融和行政 | 780 | 325 | 455 |
| 自然和应用科学领域工作 | 445 | 315 | 130 |
| 卫生保健行业 | 130 | 65 | 70 |
| 教育,法律,社区和政府工作 | 385 | 155 | 235 |
| 艺术,休闲,文化和体育行业 | 195 | 120 | 75 |
| 销售和服务性行业 | 710 | 340 | 375 |
| 技术工人,运输业,操作工及相关行业 | 220 | 195 | 30 |
| 自然资源,农业及相关行业 | 15 | 10 | 0 |
| 加工行业和公共事业 | 15 | 0 | 15 |