
Aberdeen Centre 美食广场商铺转让(MLS#C8075169)
3260 4151 Hazelbridge Way, Richmond, Vancouver, BC V6X 0A4 地图周边 | 社区结构
物件说明
- iU91编号 146094
- 发布人 地产经纪
特色说明
仅限预约参观,请勿打扰店内员工
Aberdeen Centre 美食广场商铺转让!
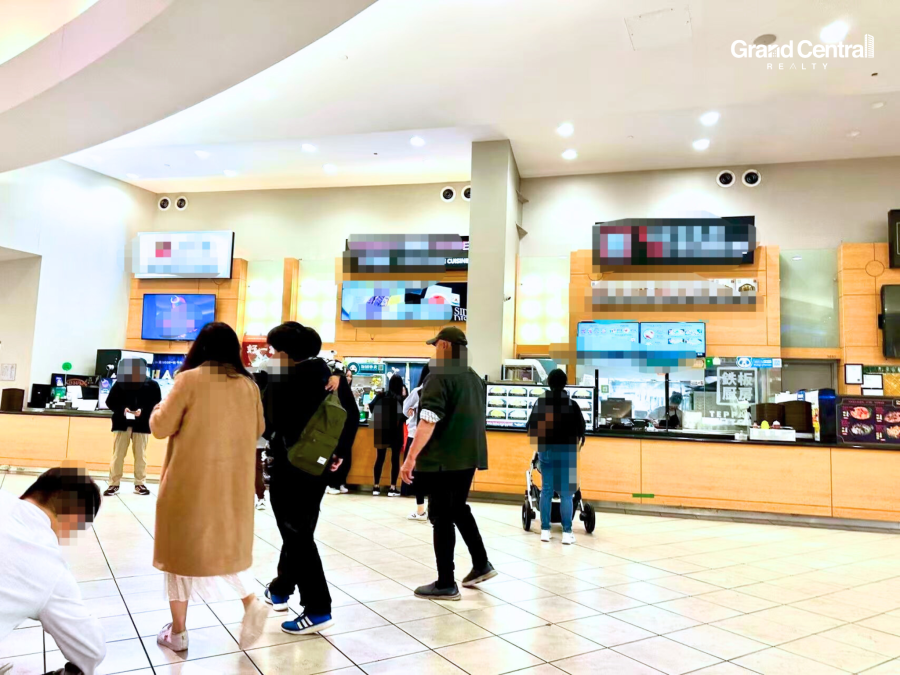
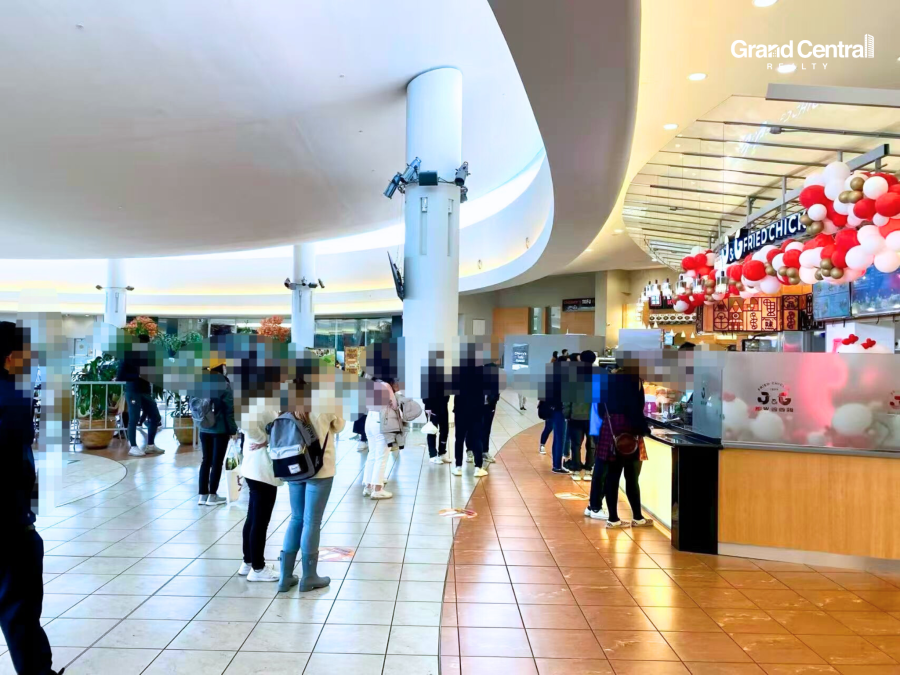
难得机会入驻Richmond最受欢迎、最成熟的 Aberdeen Centre,该商场人流量大,客源稳定,位置极佳。商铺紧邻 Aberdeen SkyTrain 站,周边高客流量,曝光率极高。
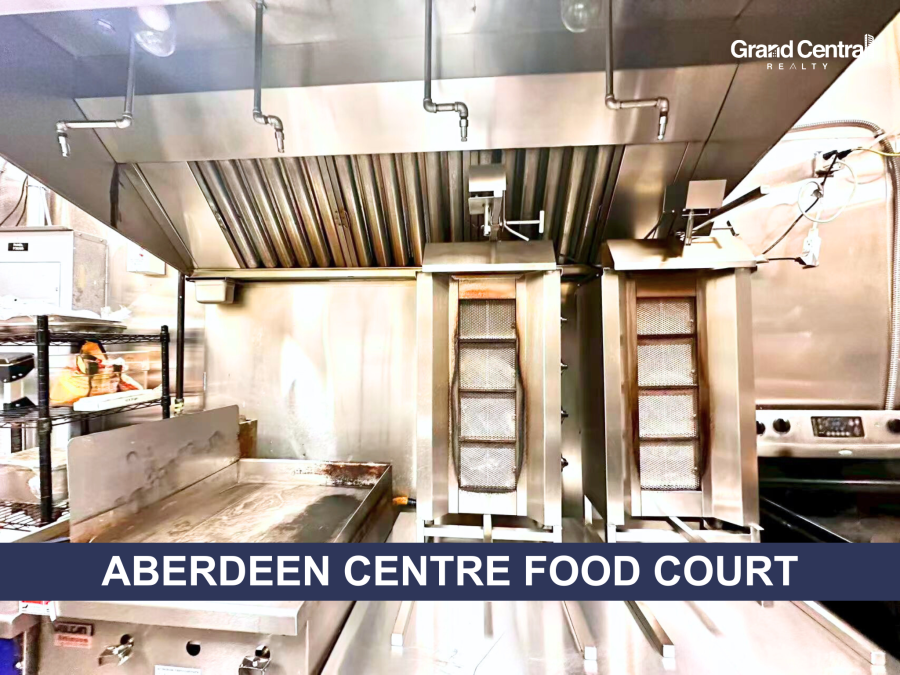
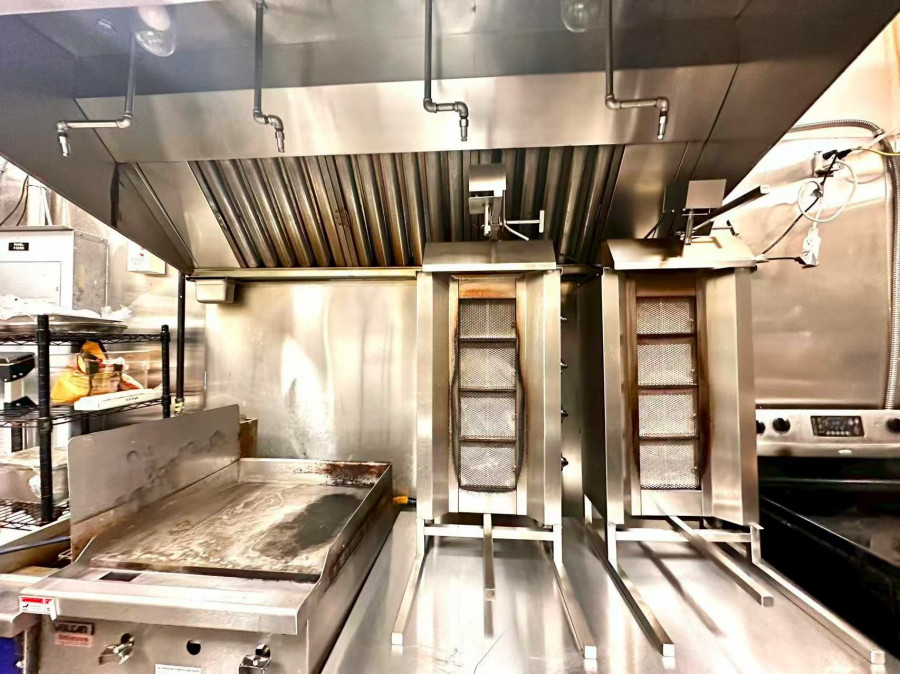
该单元面积约 350 平方英尺,配备 商业排风系统,旁边设有独立储物间,方便存放物品。合理租金及充足停车位,使运营轻松便捷。空间适合多种餐饮概念。
商铺每日开放,适合首次创业者或经验丰富的餐饮经营者,为在黄金地段推出新餐饮概念提供理想机会。
请立即联系挂牌经纪了解更多信息。
Showings by appointment only. Please do not disturb staff.
Aberdeen Centre Food Court Business for Sale!
Rare opportunity to acquire a food court business in the highly sought-after Aberdeen Centre, one of Richmond’s busiest and most established shopping malls. Prime location next to the Aberdeen SkyTrain station, surrounded by high foot traffic.
This 350 sq.ft. unit is fully equipped with a commercial ventilation hood and includes a Individual storage room right beside the unit. Reasonable rent and ample mall parking make operations easy and convenient. Suitable for a wide range of food concepts.
Open seven days a week, this business is an ideal opportunity for both first-time operators and experienced restaurateurs looking to introduce a new concept in a prime mall location.
Please contact the listing agent today for more information.
地图周边
社区结构2021年人口统计数据
人口统计
| 总计 | 男性 | 女性 | |
| 2021年该地区人口数量 | 7,045 | ... | ... |
|---|---|---|---|
| 2016年该地区人口数量 | 3,566 | ... | ... |
| 2006年到2011年该地区人口变化率 | 97.6 | ... | ... |
| 个人住宅数量 | 3,931 | ... | ... |
| 正常使用的个人住宅数量 | 3,613 | ... | ... |
| 每平方公里人口密度 | 2,373.7 | ... | ... |
| 该地区土地面积(平方公里) | 2.97 | ... | ... |
房价租金统计
| 总计 | 男性 | 女性 | |
| 平均房价 ($) | 775,000 | ... | ... |
|---|---|---|---|
| 养房开销(包括税,贷款,水电煤,管理费) ($) | 1,712 | ... | ... |
| 有房屋贷款的居民比例 (%) | 58.8 | ... | ... |
| 租房开销(包括租金,水电煤,服务费) ($) | 1,806 | ... | ... |
| 独立房 | 145 | ... | ... |
| 公寓(5层以上大楼) | 2,645 | ... | ... |
| 半独立屋 | 15 | ... | ... |
| 排屋 | 280 | ... | ... |
| Duplex里的公寓 | 120 | ... | ... |
| 公寓(4层以下大楼) | 405 | ... | ... |
| 其他独立住宅 | 0 | ... | ... |
| 临时房 | 0 | ... | ... |
收入统计
| 总计 | 男性 | 女性 | |
| 2020年家庭平均收入 | 84,500 | ... | ... |
|---|---|---|---|
| 2020年家庭平均税后收入 | 74,200 | ... | ... |
| 家庭平均人口 | 2.5 | ... | ... |
| 2020年无子女的家庭平均收入 | 81,400 | ... | ... |
| 2020年无子女的家庭平均税后收入 | 71,000 | ... | ... |
| 无子女的家庭平均人口 | 2.0 | ... | ... |
| 2020年有子女家庭平均收入 | 101,200 | ... | ... |
| 2020年有子女家庭平均税后收入 | 89,600 | ... | ... |
| 有子女家庭平均人口 | 3.6 | ... | ... |
| 2020年单亲家庭平均收入 | 60,600 | ... | ... |
| 2020年单亲家庭平均税后收入 | 55,000 | ... | ... |
| 单亲家庭平均人口 | 2.4 | ... | ... |
语言统计
| 总计 | 男性 | 女性 | |
| 只说英语的人数 | 5,985 | 2,940 | 3,045 |
|---|---|---|---|
| 只说法语的人数 | 5 | 5 | 0 |
| 可以说英法语的人数 | 190 | 85 | 105 |
| 不懂法语和英语的人数 | 795 | 330 | 470 |
族裔统计
| 总计 | 男性 | 女性 | |
| 南亚人 | 195 | 105 | 90 |
|---|---|---|---|
| 中国人 | 4,840 | 2,250 | 2,585 |
| 黑人 | 35 | 15 | 15 |
| 菲律宾人 | 275 | 120 | 150 |
| 阿拉伯人 | 65 | 45 | 25 |
| 拉丁美洲人 | 90 | 40 | 45 |
| 东南亚人 | 135 | 70 | 65 |
| 西亚人 | 60 | 40 | 20 |
| 韩国人 | 120 | 55 | 60 |
| 日本人 | 115 | 40 | 70 |
| 其他民族 | 10 | 0 | 0 |
| 属于多个民族的后裔 | 220 | 110 | 110 |
| 非少数民族 | 810 | 440 | 365 |
职业统计
| 总计 | 男性 | 女性 | |
| 立法和高级管理职位 | 30 | 25 | 0 |
|---|---|---|---|
| 商业,金融和行政 | 935 | 350 | 590 |
| 自然和应用科学领域工作 | 440 | 325 | 115 |
| 卫生保健行业 | 165 | 60 | 105 |
| 教育,法律,社区和政府工作 | 235 | 95 | 140 |
| 艺术,休闲,文化和体育行业 | 190 | 75 | 110 |
| 销售和服务性行业 | 1,380 | 670 | 715 |
| 技术工人,运输业,操作工及相关行业 | 335 | 300 | 35 |
| 自然资源,农业及相关行业 | 10 | 10 | 0 |
| 加工行业和公共事业 | 115 | 70 | 40 |