UBC大学村核心地段临街餐厅(MLS#C8069130)
新盘
2158 Western Pky, Vancouver, BC V6T 1V6 地图周边 | 社区结构
物件说明
- iU91编号 140559
- 发布人 地产经纪
特色说明
仅限预约参观,请勿打扰工作人员。 位于UBC大学村核心地段,这家3,133平方英尺的临街餐厅,坐拥温哥华最具活力的学术与住宅社区之一,堪称绝佳的交钥匙经营机会。餐厅配备超过40英尺的高效商业抽风系统,厨房设备齐全,适合多种餐饮业态。宽敞整洁的用餐区支持堂食与高频外卖业务,布局灵活,适应不同经营模式。目前餐厅经营中式餐饮,另设有充足的储藏空间、员工设施以及顾客与员工专用停车位。地段优越、曝光率高,紧邻UBC学生、教职员工与周边居民区,客流稳定、消费力强,是新品牌落地或成熟餐饮拓展业务的理想选择。 请联系代理经纪了解更多信息
*Showing by appointment only, do not disturb staff. *
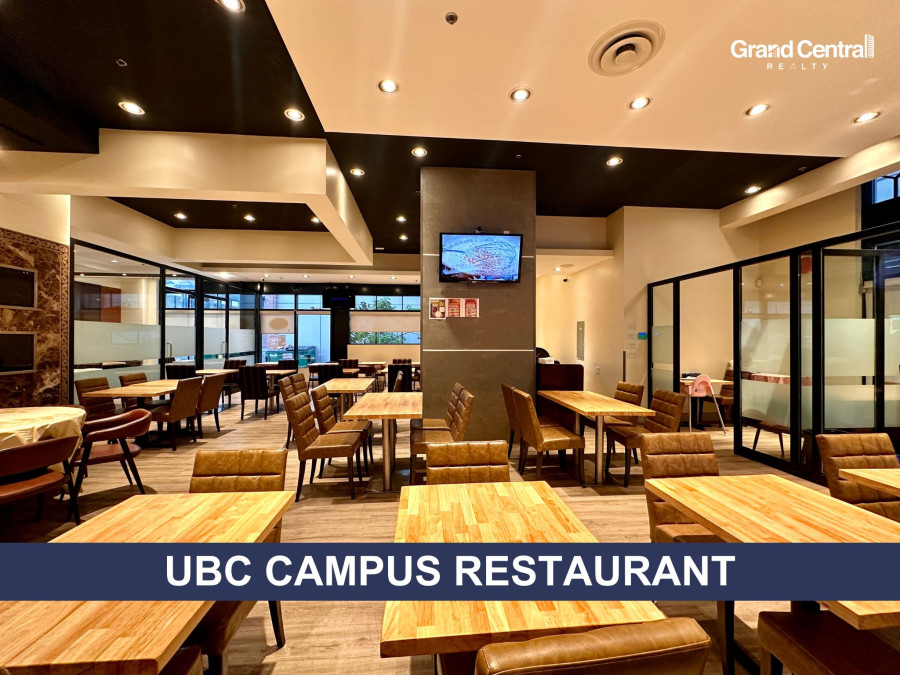
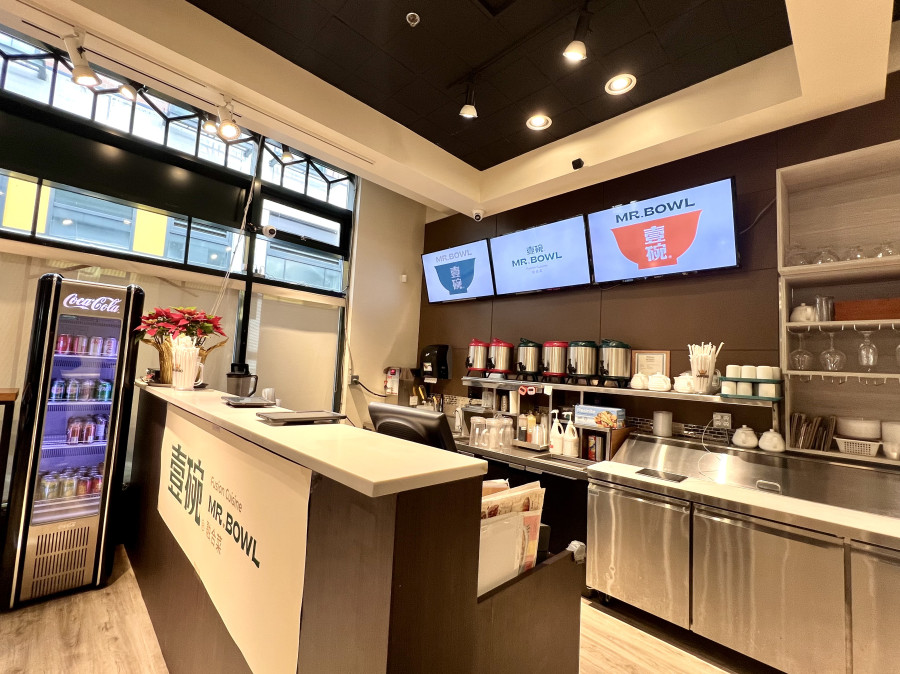
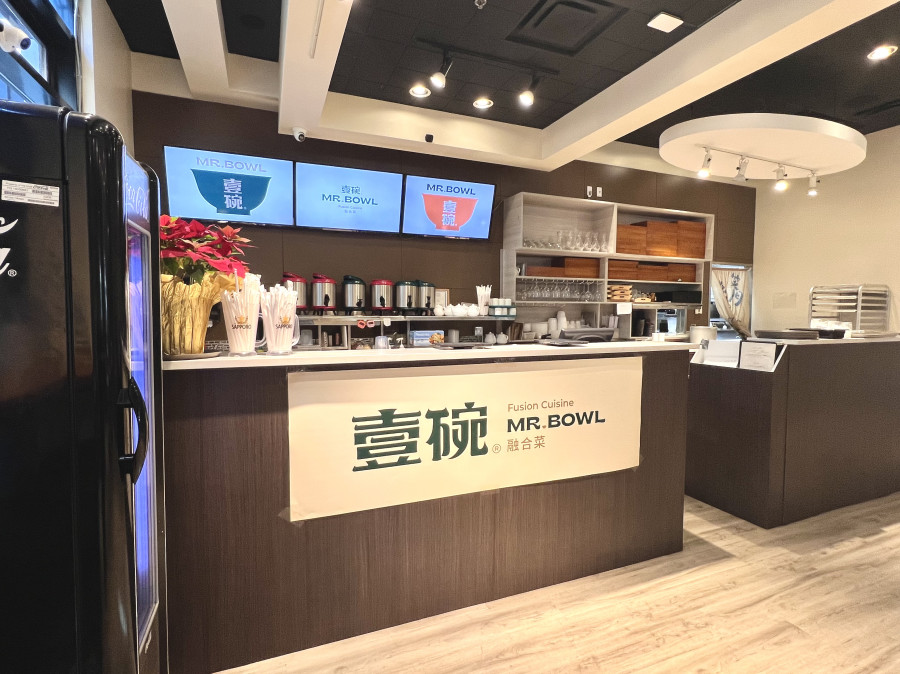
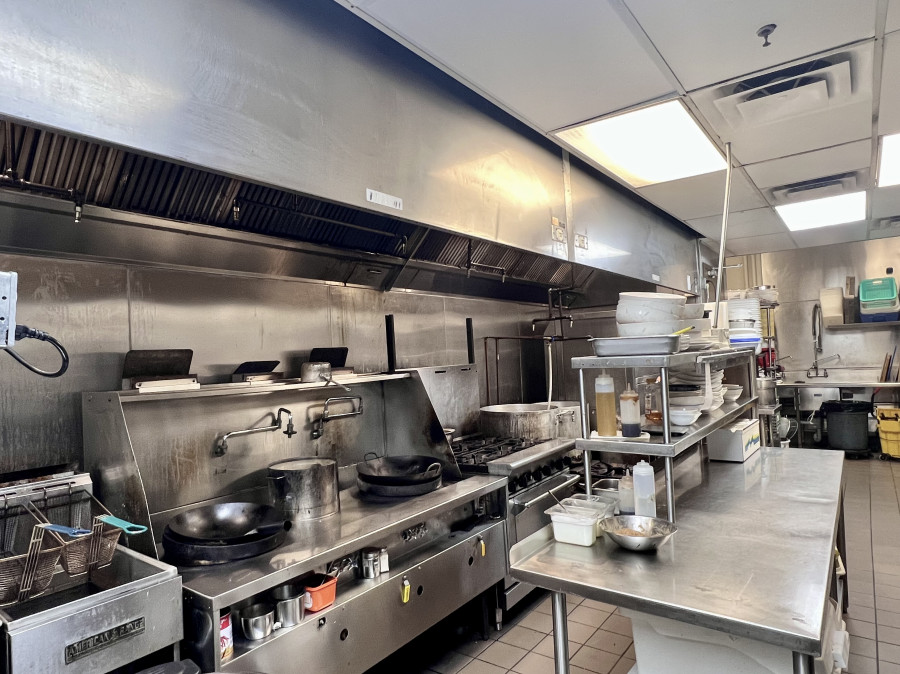
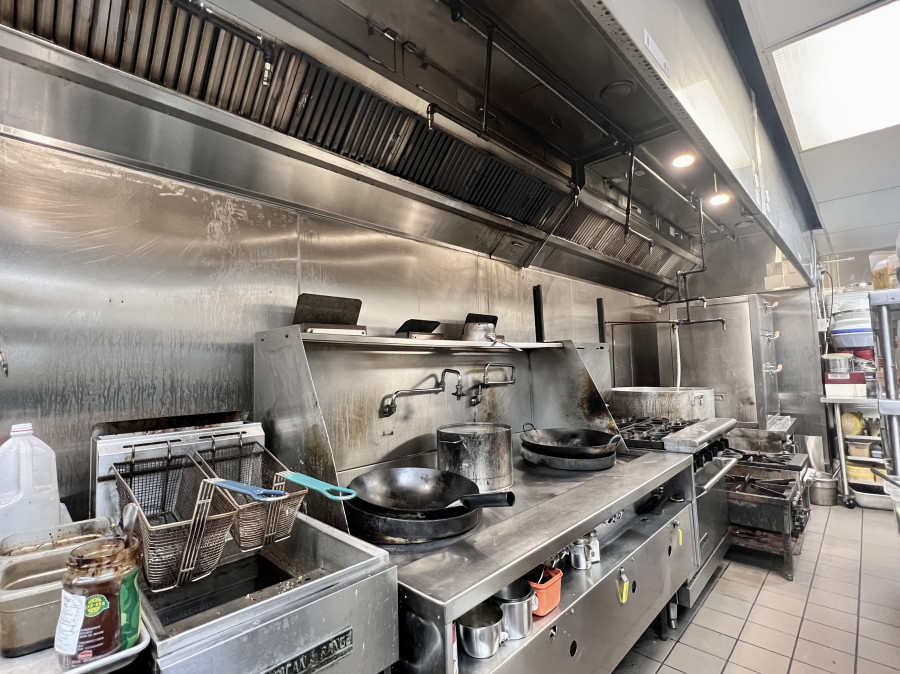
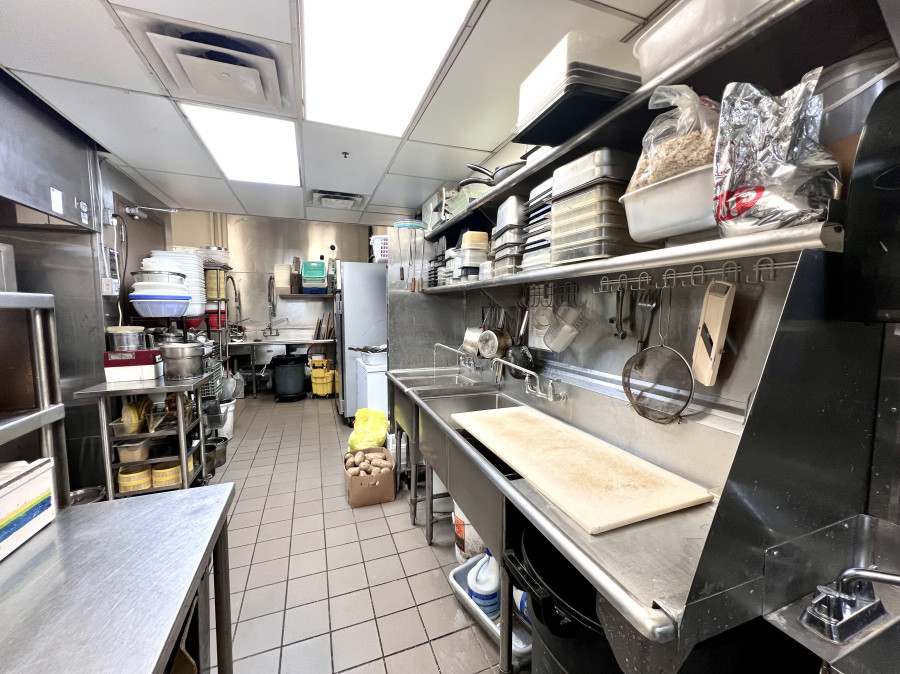
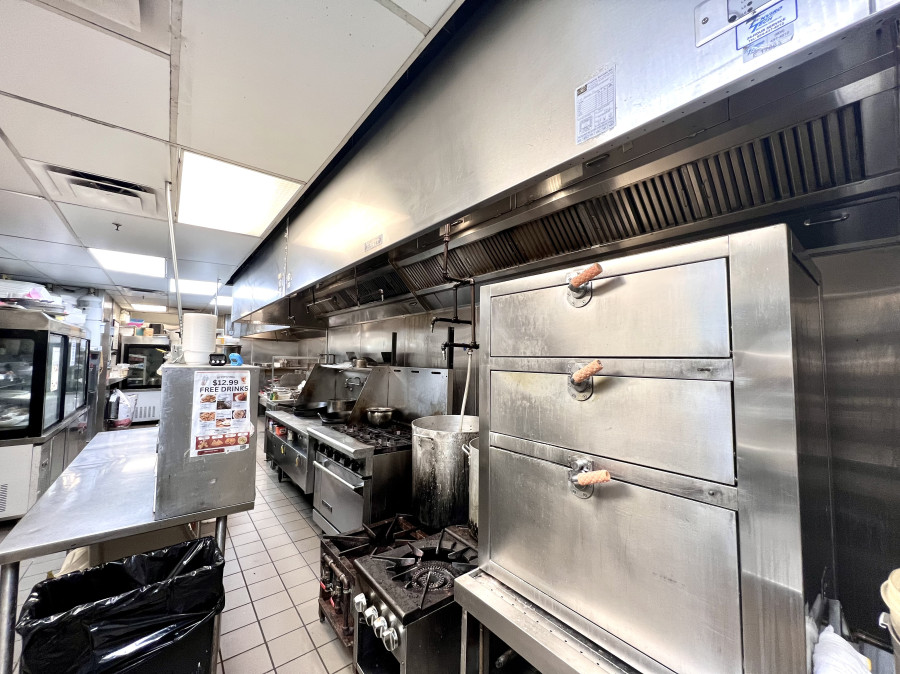
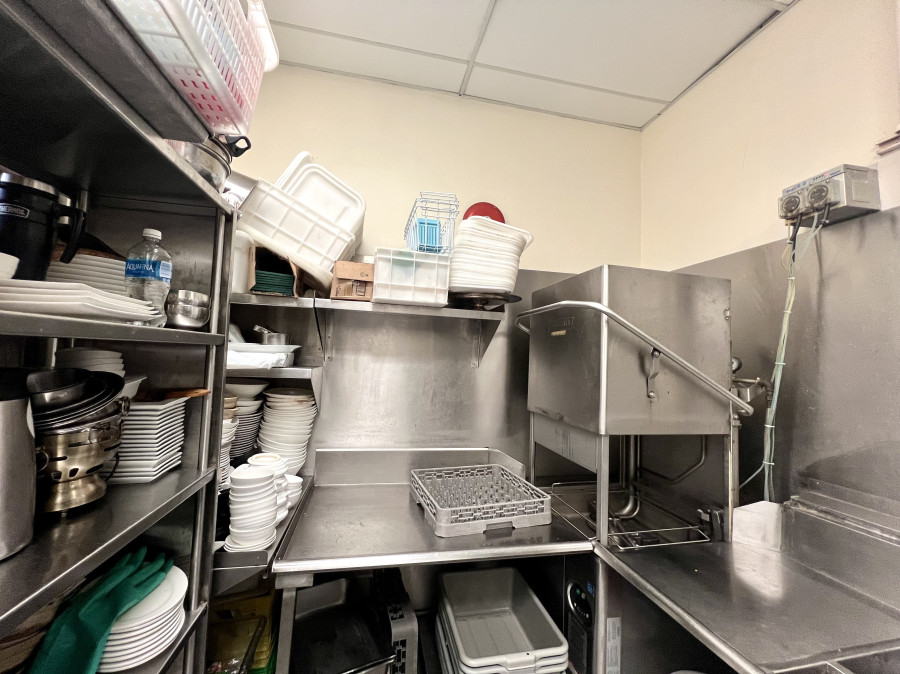
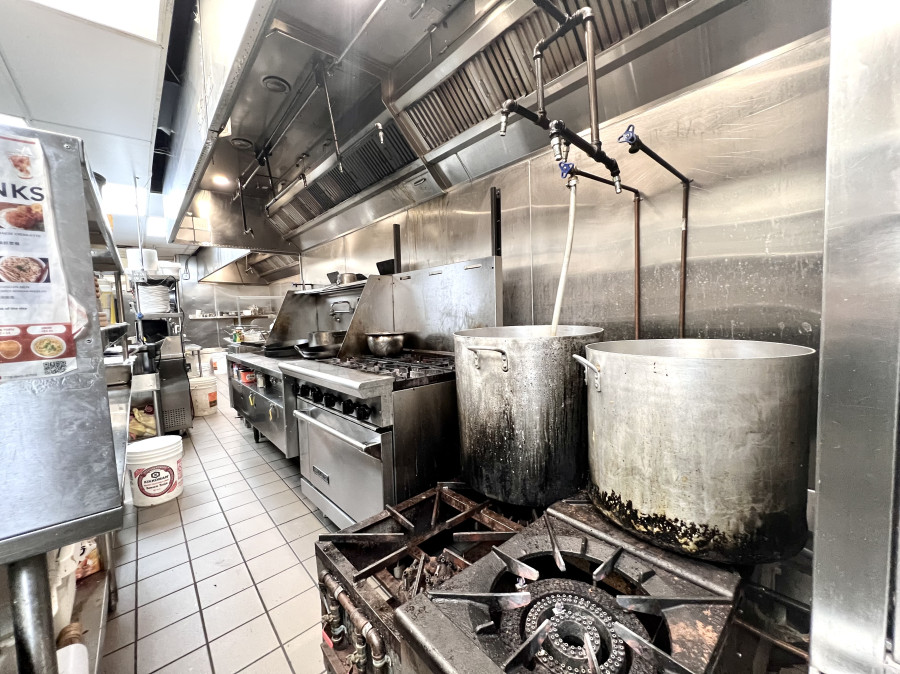
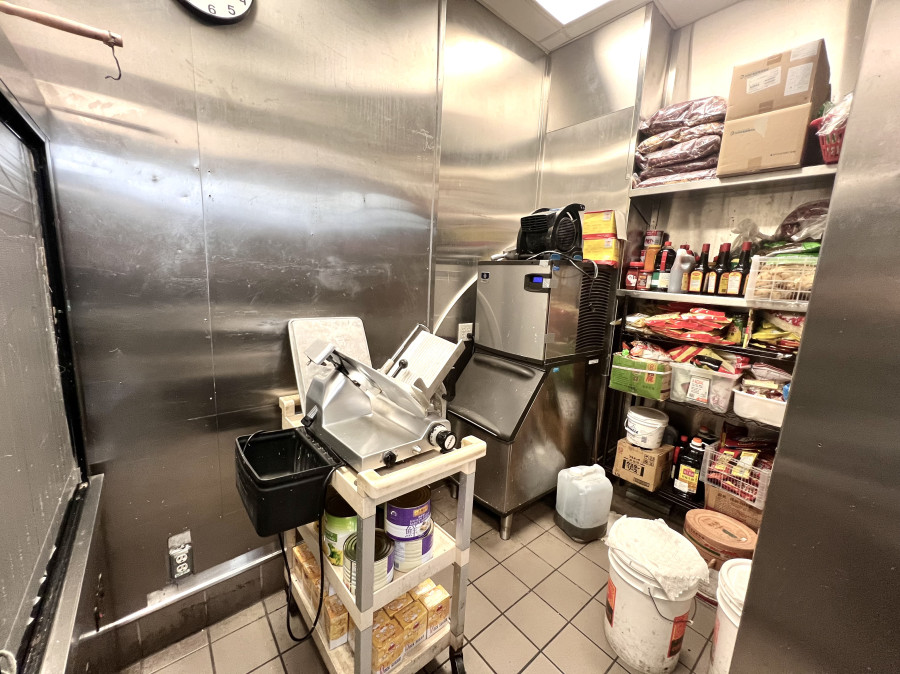
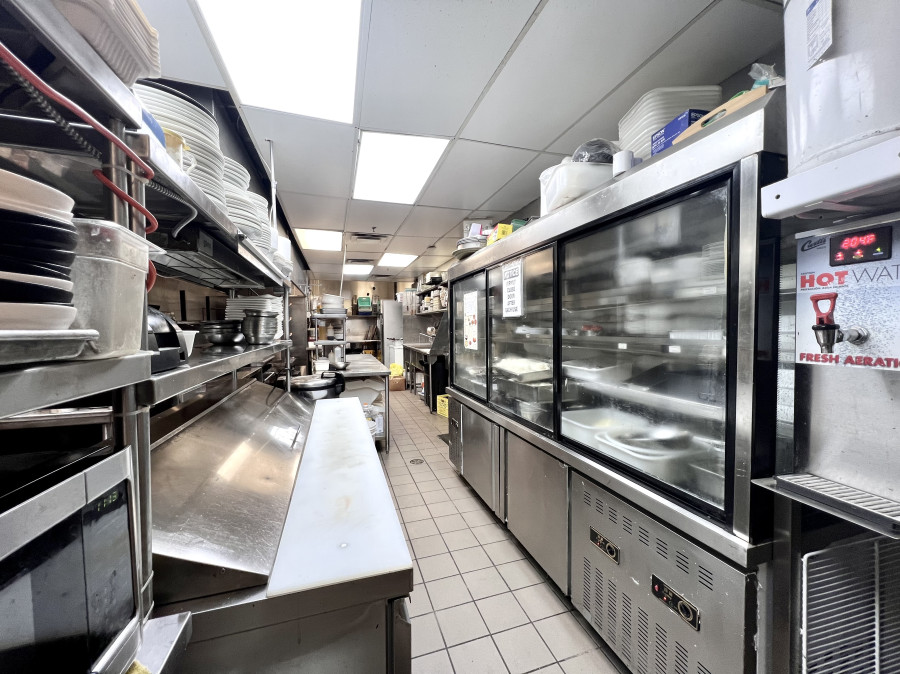
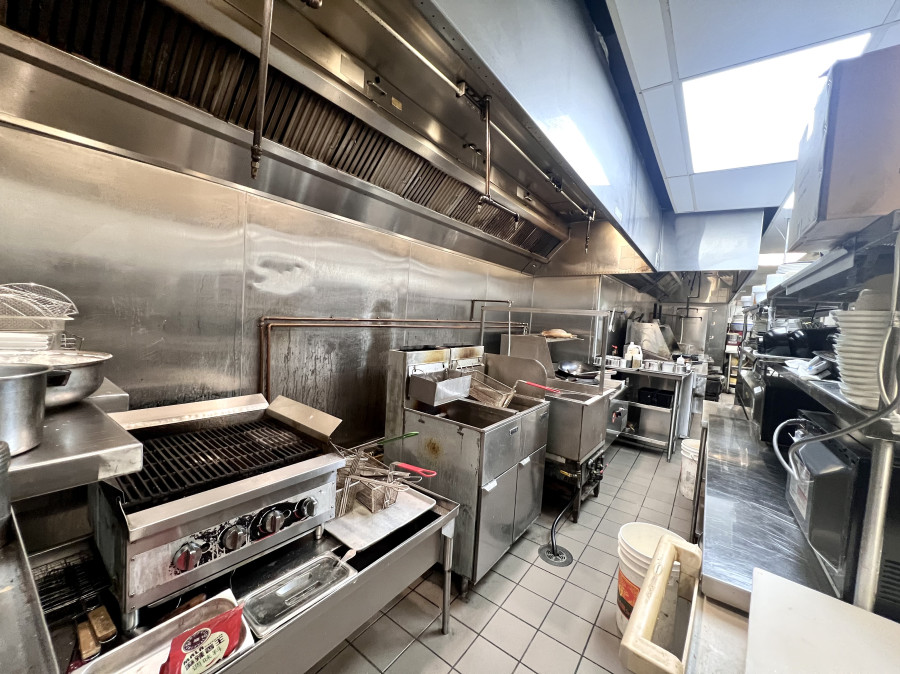
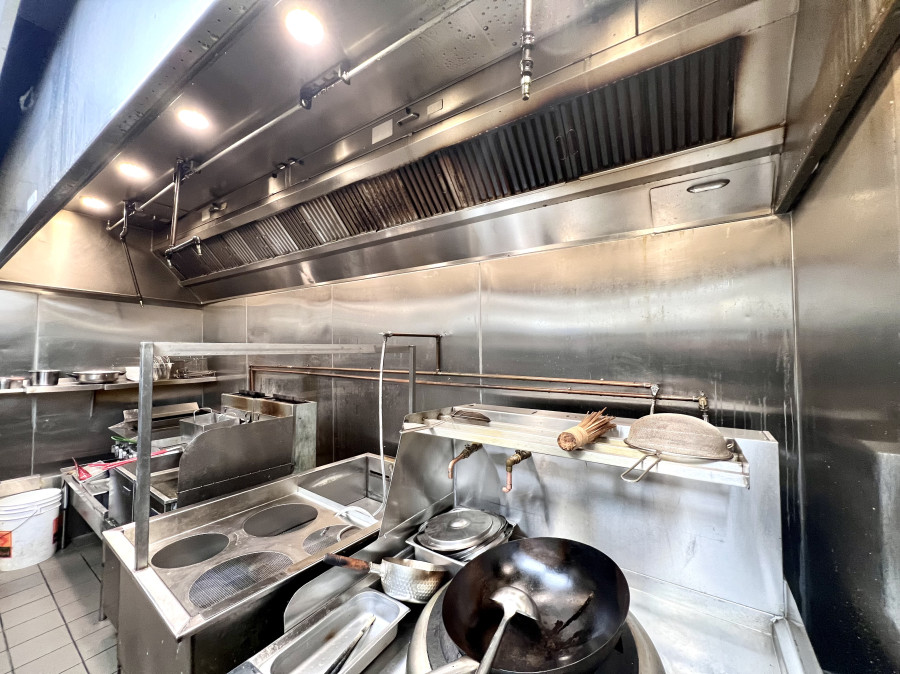
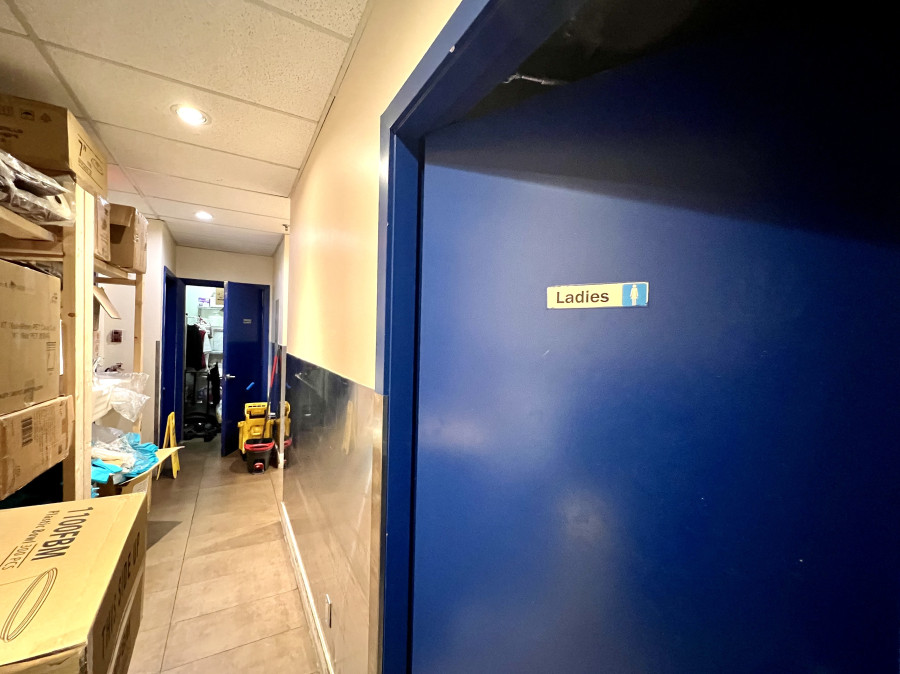
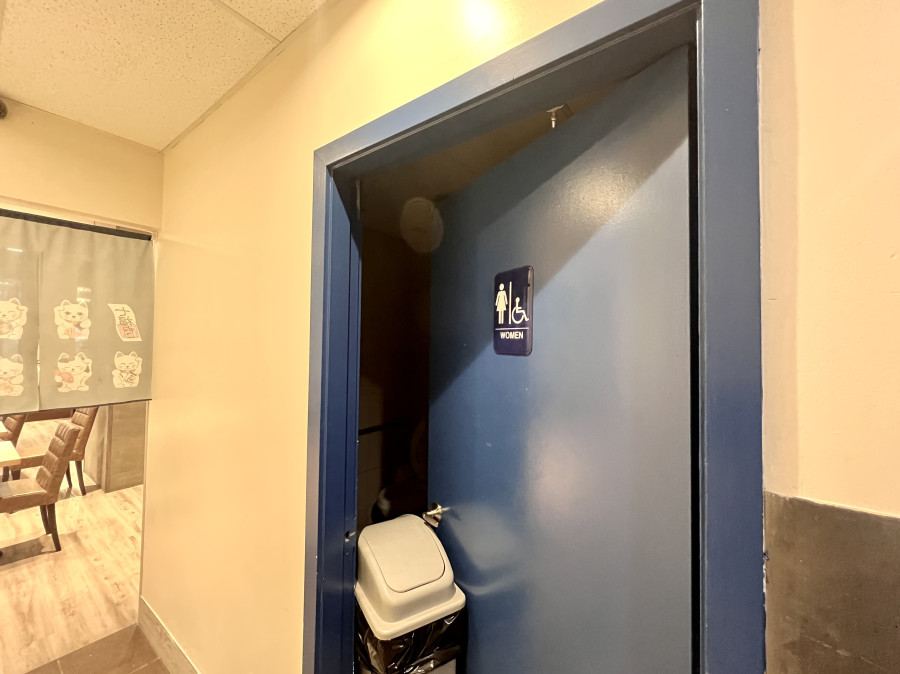
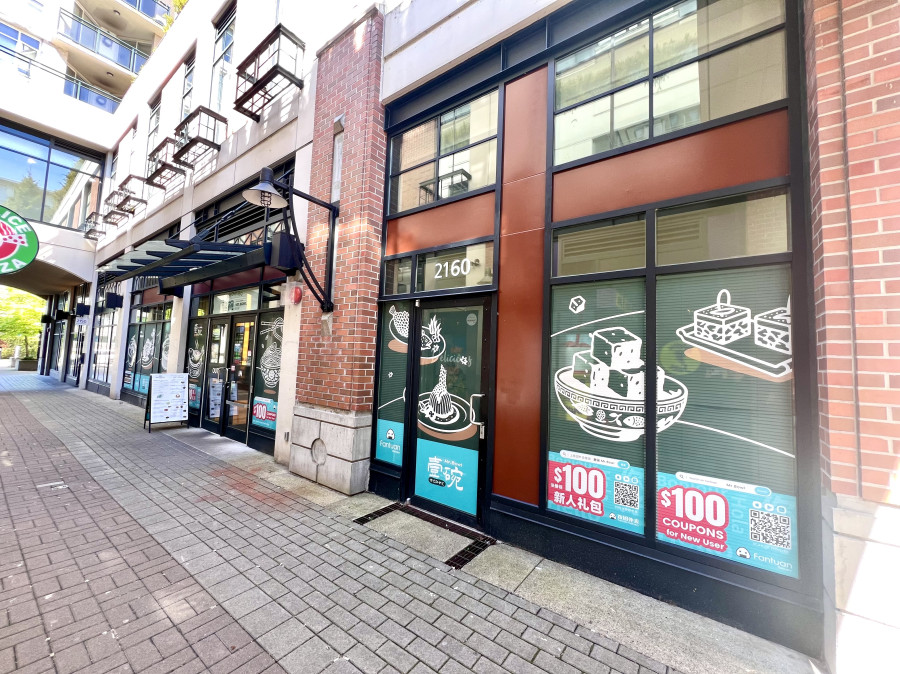
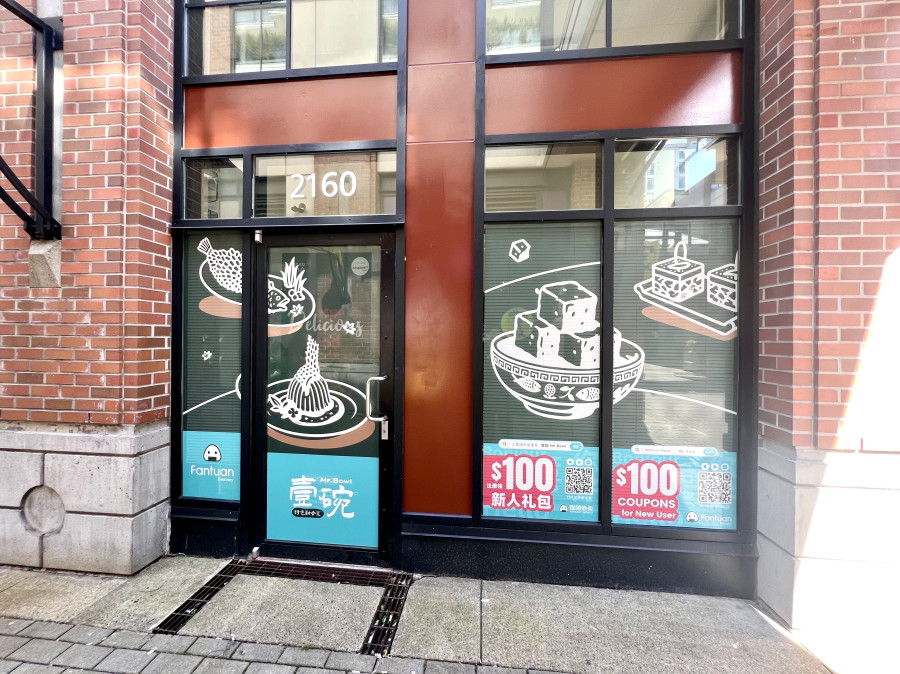
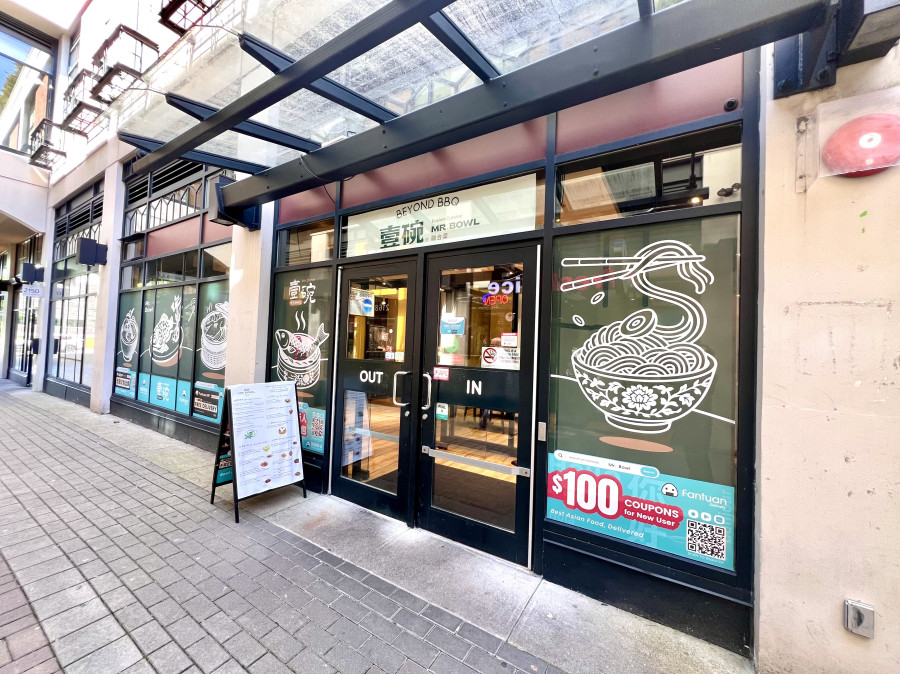
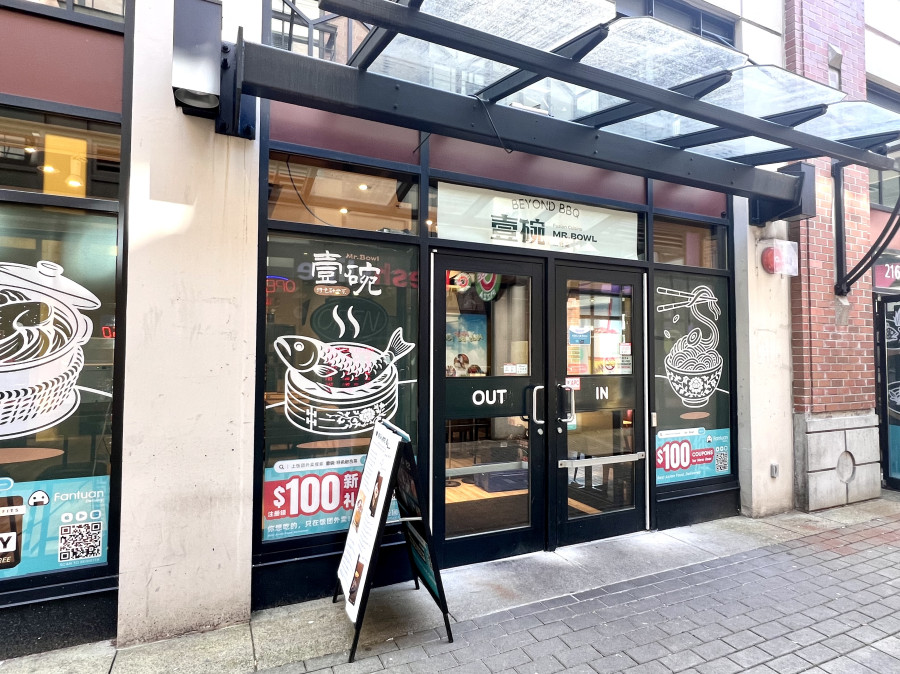
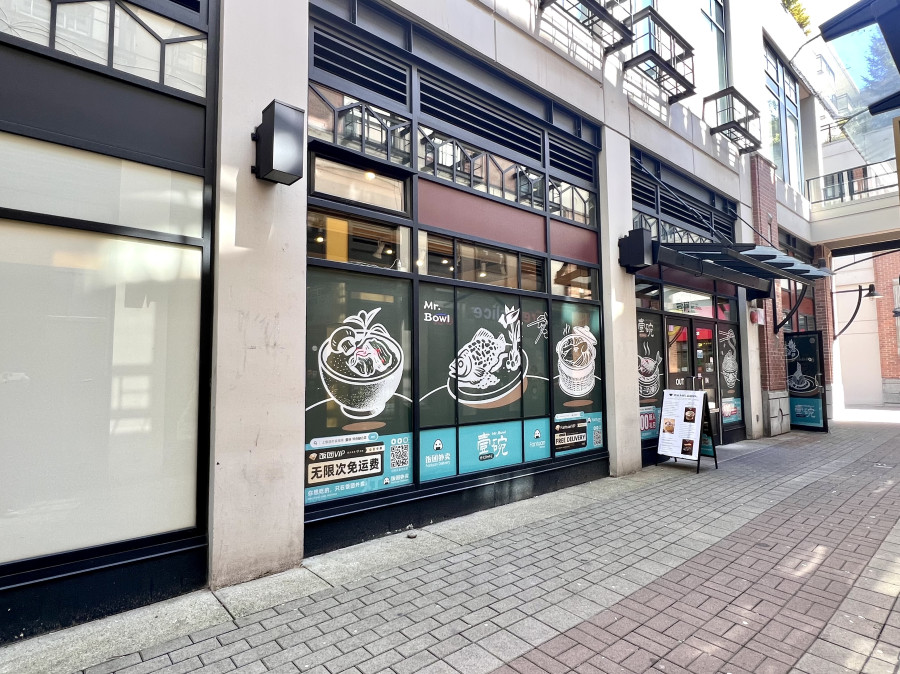
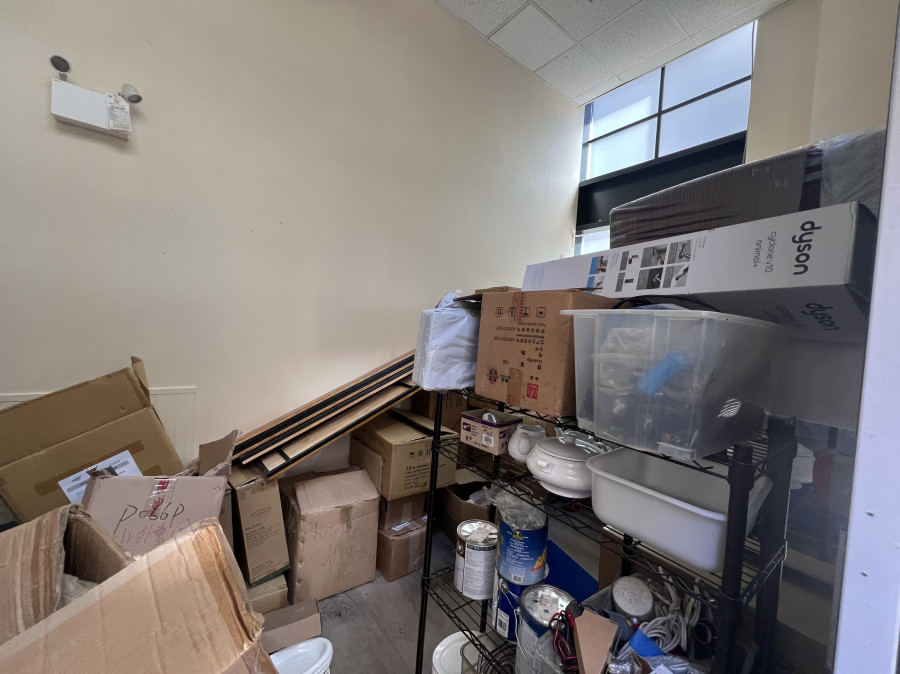
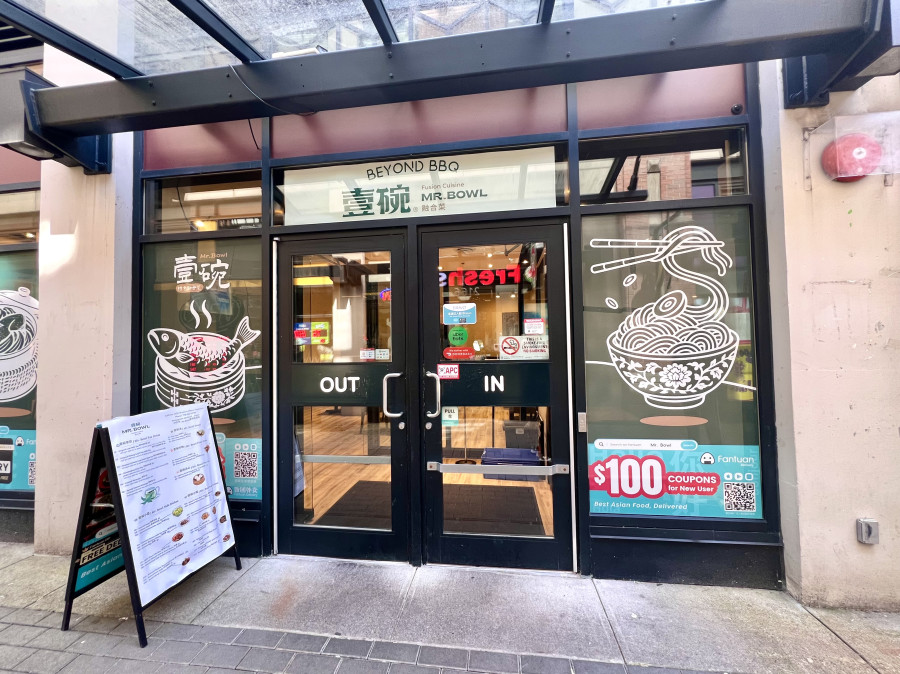
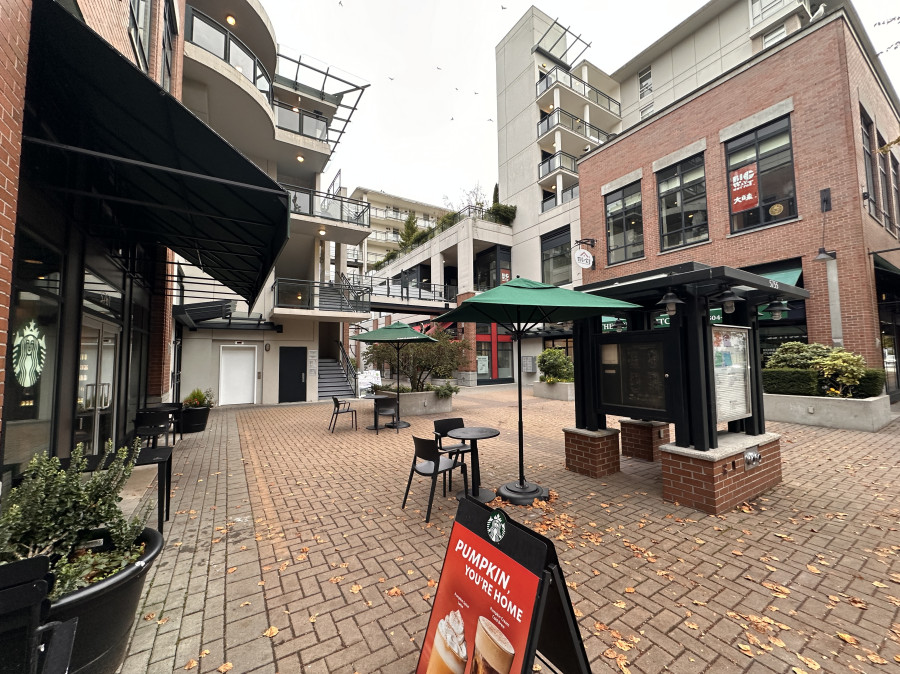
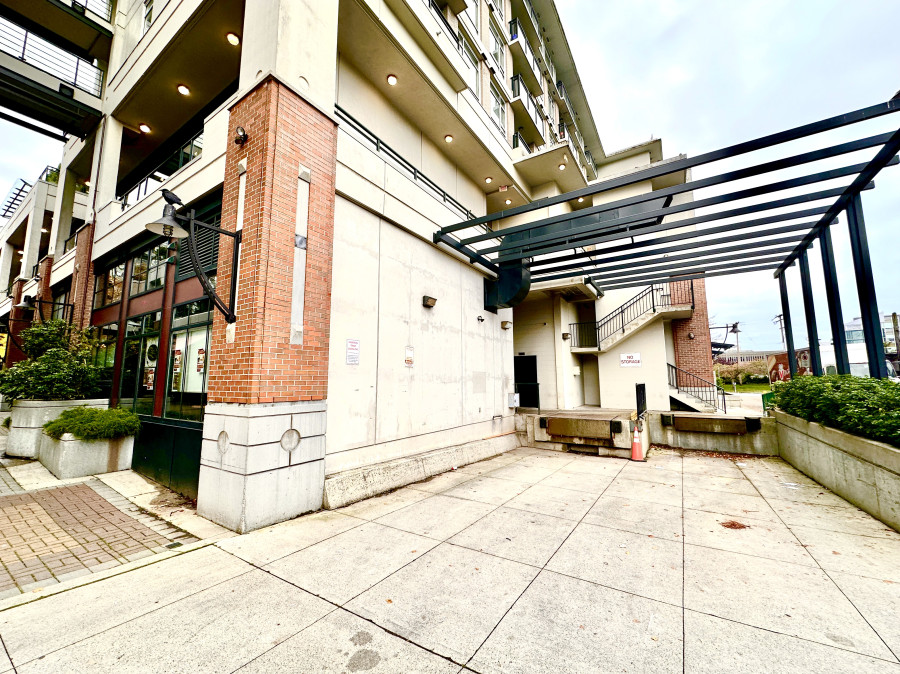
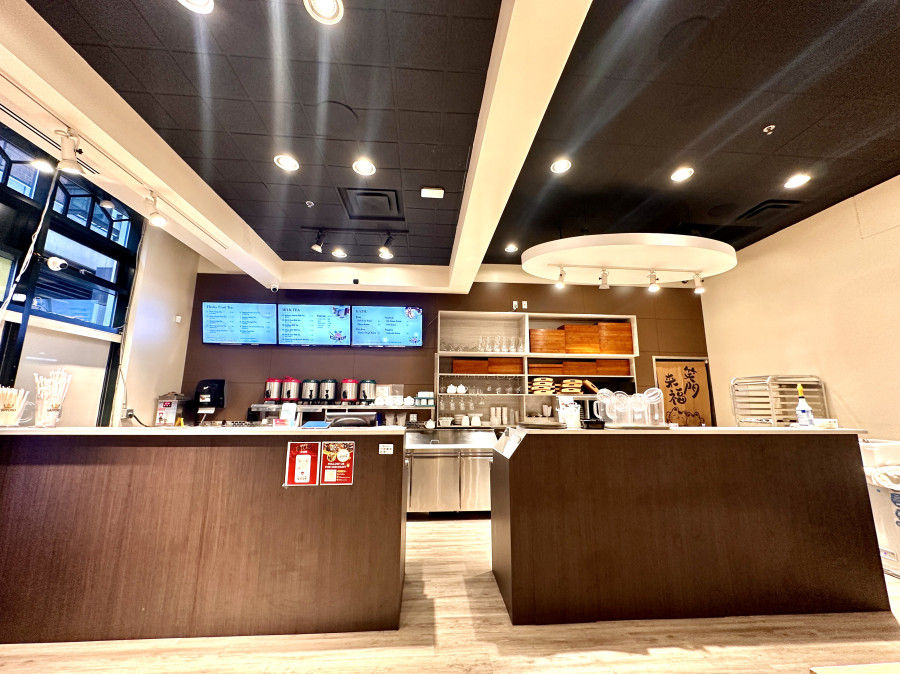
Located in the heart of UBC’s bustling University Village, this 3,133 sq ft ground-floor restaurant presents an exceptional opportunity for restaurateurs seeking a prime, turnkey location in one of Vancouver’s most vibrant academic and residential communities. The property boasts a fully equipped commercial kitchen with over 40 feet of high-capacity ventilation, ideal for a wide range of culinary concepts. The spacious, well-maintained dining area is designed to accommodate both sit-down service and high-volume takeout, making it adaptable to various business models. Currently operating as a popular Chinese restaurant, the premises come with ample storage, staff facilities, and convenient on-site customer and staff parking. Surrounded by high foot traffic from students, faculty, and local residents, this highly visible location offers strong demographics, steady customer flow, and significant growth potential for both new ventures and expanding brands.
Please contact the listing agent for more information today!
地图周边
社区结构2021年人口统计数据
人口统计
总计 | 男性 | 女性 | |
2021年该地区人口数量 | 2,810 | ... | ... |
---|---|---|---|
2016年该地区人口数量 | 2,912 | ... | ... |
2006年到2011年该地区人口变化率 | - 3.5 | ... | ... |
个人住宅数量 | 1,537 | ... | ... |
正常使用的个人住宅数量 | 1,272 | ... | ... |
每平方公里人口密度 | 903.8 | ... | ... |
该地区土地面积(平方公里) | 3.11 | ... | ... |
房价租金统计
总计 | 男性 | 女性 | |
平均房价 ($) | 4,100,000 | ... | ... |
---|---|---|---|
养房开销(包括税,贷款,水电煤,管理费) ($) | 3,220 | ... | ... |
有房屋贷款的居民比例 (%) | 39.8 | ... | ... |
租房开销(包括租金,水电煤,服务费) ($) | 2,200 | ... | ... |
独立房 | 365 | ... | ... |
公寓(5层以上大楼) | 260 | ... | ... |
半独立屋 | 0 | ... | ... |
排屋 | 25 | ... | ... |
Duplex里的公寓 | 50 | ... | ... |
公寓(4层以下大楼) | 565 | ... | ... |
其他独立住宅 | 0 | ... | ... |
临时房 | 0 | ... | ... |
收入统计
总计 | 男性 | 女性 | |
2020年家庭平均收入 | 216,400 | ... | ... |
---|---|---|---|
2020年家庭平均税后收入 | 146,000 | ... | ... |
家庭平均人口 | 2.8 | ... | ... |
2020年无子女的家庭平均收入 | 384,000 | ... | ... |
2020年无子女的家庭平均税后收入 | 220,000 | ... | ... |
无子女的家庭平均人口 | 2.0 | ... | ... |
2020年有子女家庭平均收入 | 166,000 | ... | ... |
2020年有子女家庭平均税后收入 | 139,000 | ... | ... |
有子女家庭平均人口 | 3.8 | ... | ... |
2020年单亲家庭平均收入 | 88,000 | ... | ... |
2020年单亲家庭平均税后收入 | 73,000 | ... | ... |
单亲家庭平均人口 | 2.5 | ... | ... |
语言统计
总计 | 男性 | 女性 | |
只说英语的人数 | 2,345 | 1,130 | 1,215 |
---|---|---|---|
只说法语的人数 | 5 | 0 | 0 |
可以说英法语的人数 | 320 | 135 | 190 |
不懂法语和英语的人数 | 140 | 50 | 90 |
族裔统计
总计 | 男性 | 女性 | |
南亚人 | 195 | 105 | 90 |
---|---|---|---|
中国人 | 1,035 | 455 | 585 |
黑人 | 15 | 15 | 0 |
菲律宾人 | 25 | 0 | 25 |
阿拉伯人 | 60 | 15 | 40 |
拉丁美洲人 | 60 | 25 | 35 |
东南亚人 | 75 | 25 | 50 |
西亚人 | 85 | 50 | 35 |
韩国人 | 90 | 15 | 75 |
日本人 | 45 | 15 | 25 |
其他民族 | 0 | 0 | 0 |
属于多个民族的后裔 | 30 | 15 | 10 |
非少数民族 | 1,025 | 525 | 500 |
职业统计
总计 | 男性 | 女性 | |
立法和高级管理职位 | 45 | 40 | 0 |
---|---|---|---|
商业,金融和行政 | 290 | 105 | 190 |
自然和应用科学领域工作 | 140 | 90 | 50 |
卫生保健行业 | 115 | 30 | 85 |
教育,法律,社区和政府工作 | 315 | 130 | 185 |
艺术,休闲,文化和体育行业 | 65 | 20 | 45 |
销售和服务性行业 | 325 | 125 | 200 |
技术工人,运输业,操作工及相关行业 | 110 | 95 | 15 |
自然资源,农业及相关行业 | 0 | 0 | 0 |
加工行业和公共事业 | 25 | 25 | 0 |