
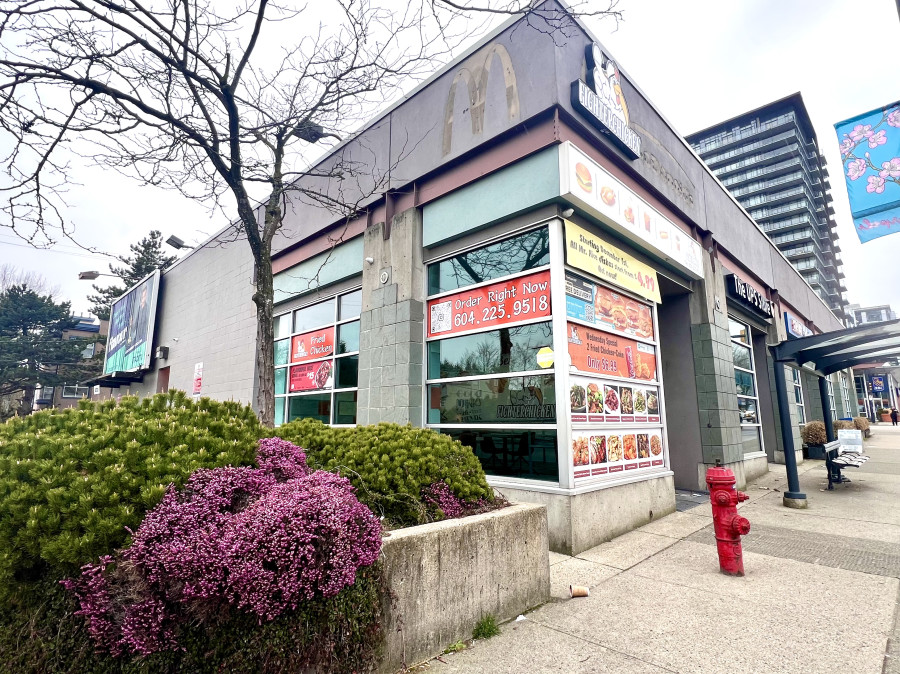
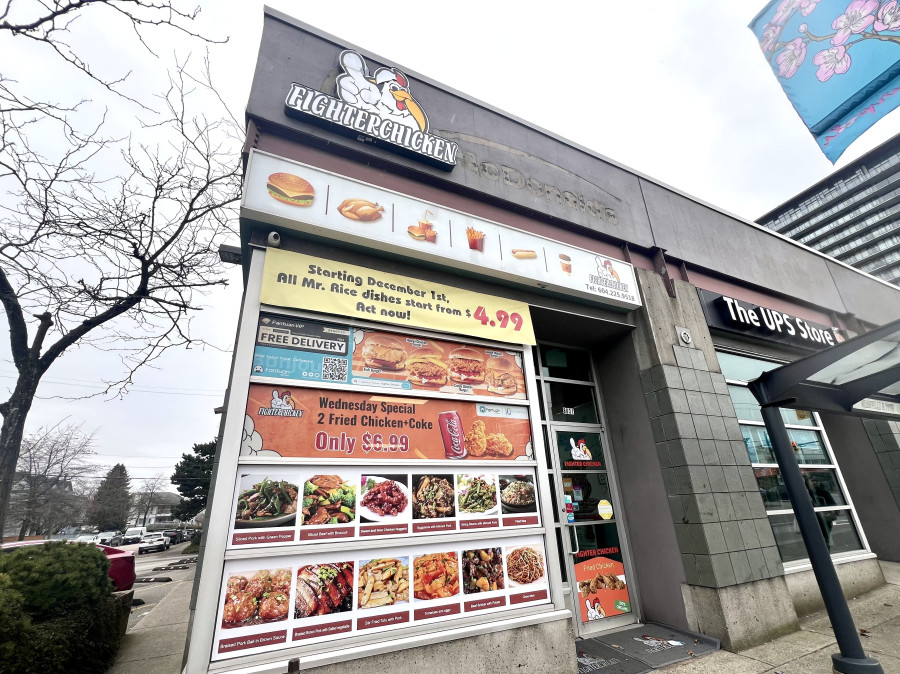
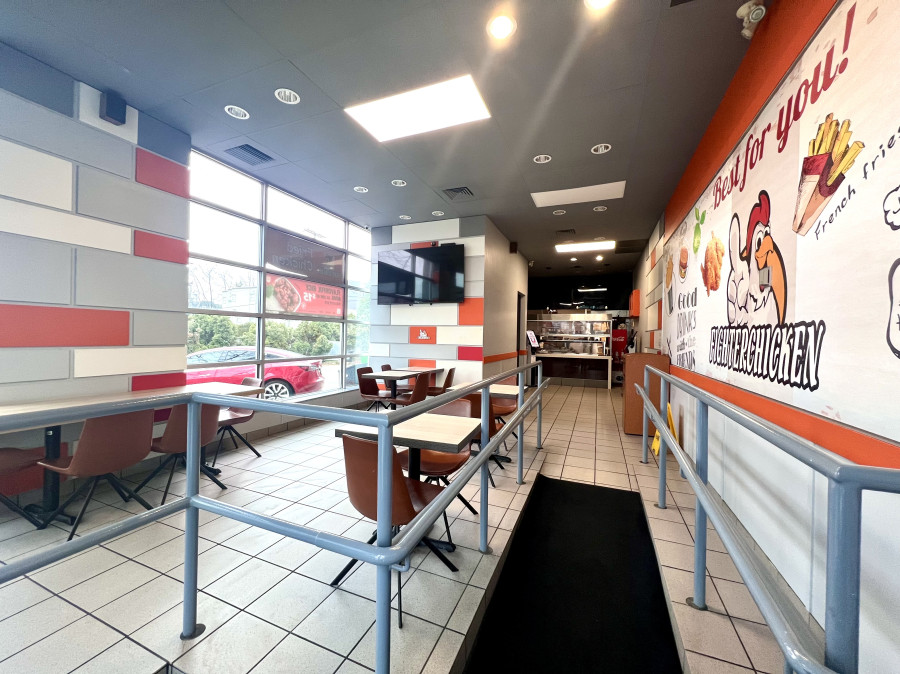
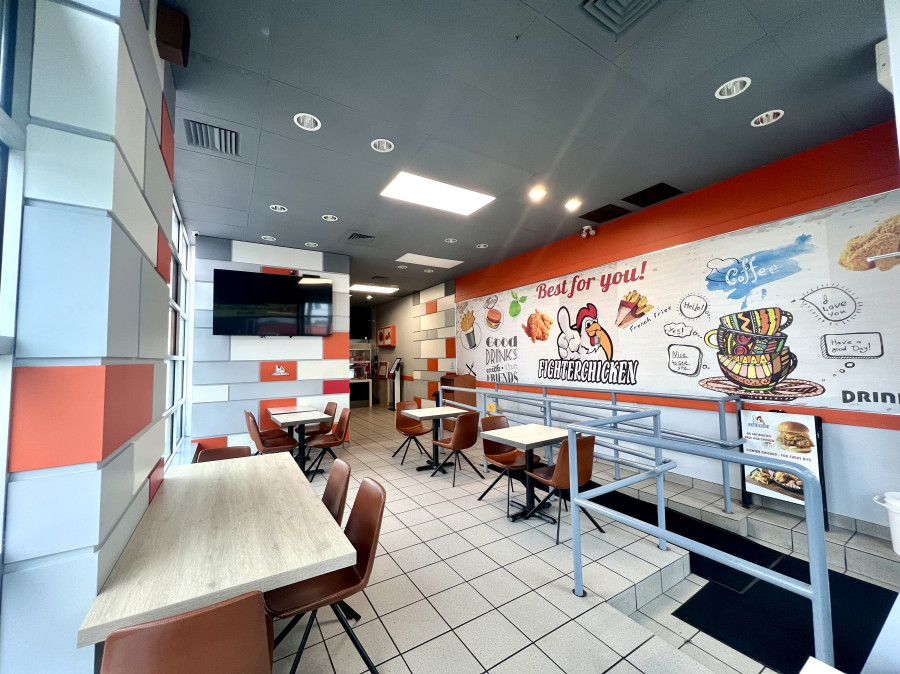
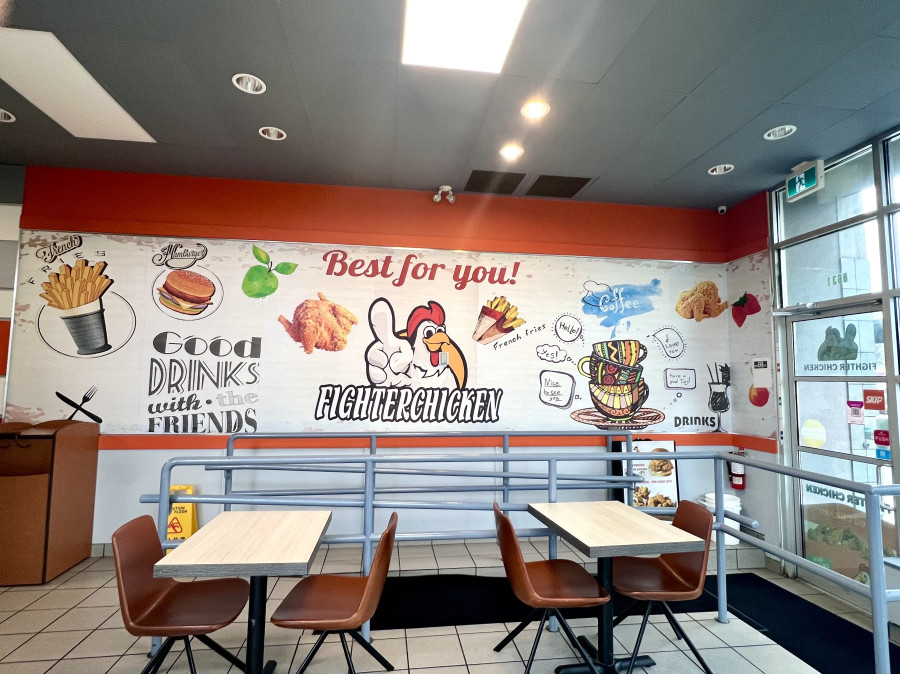
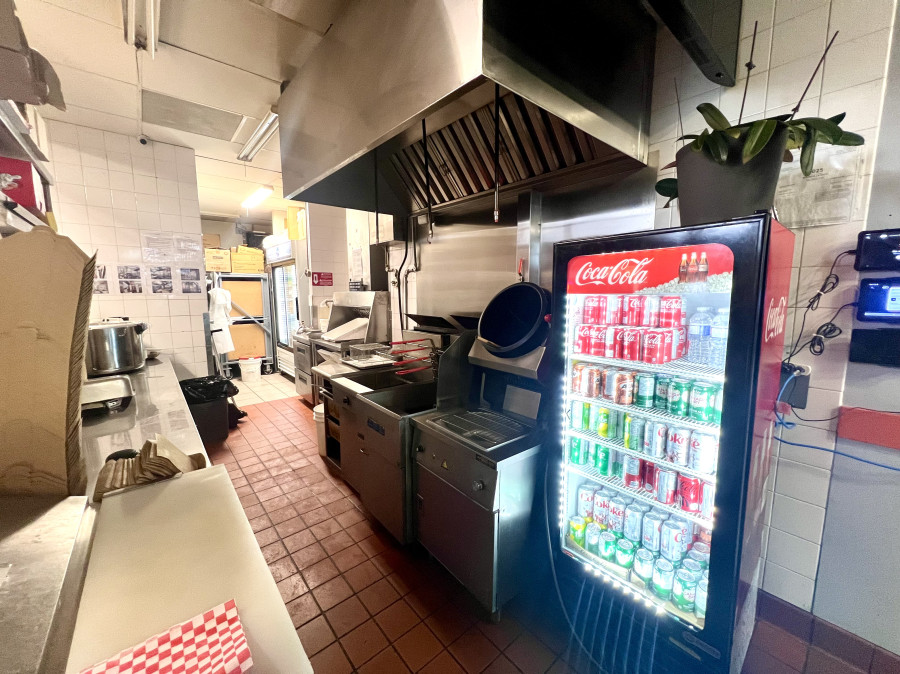
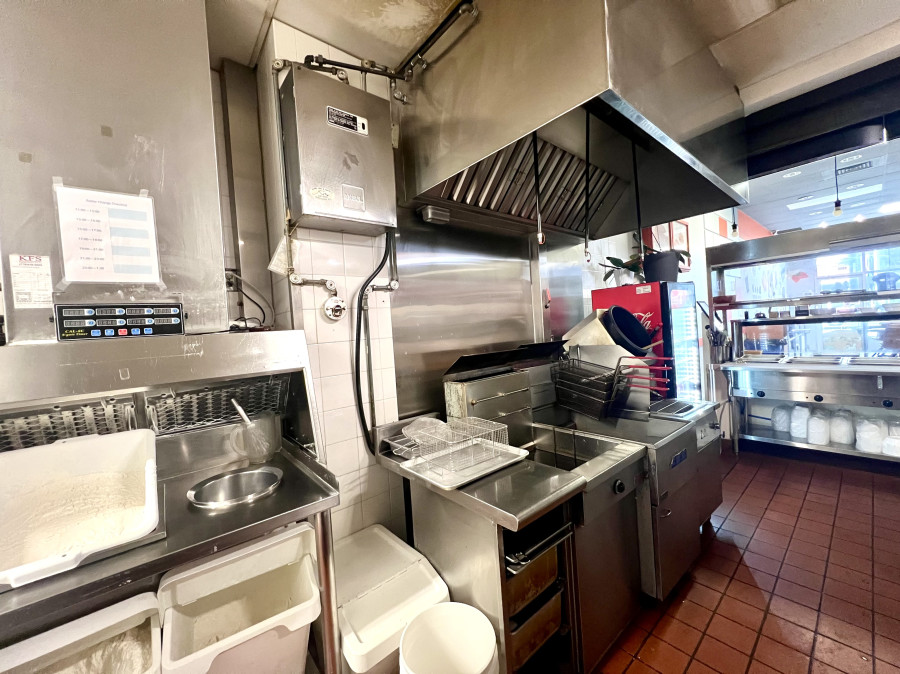
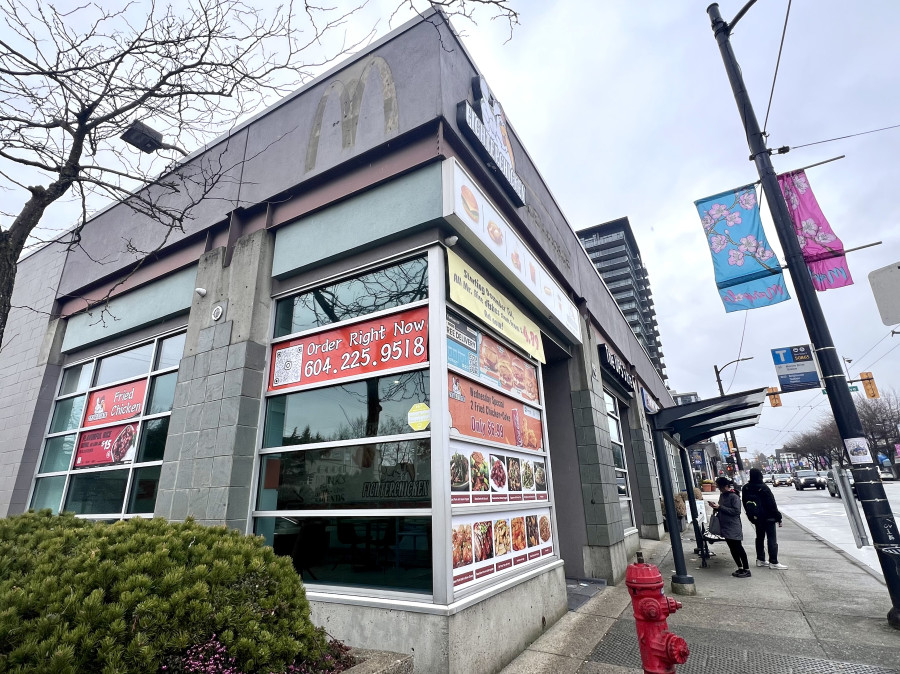
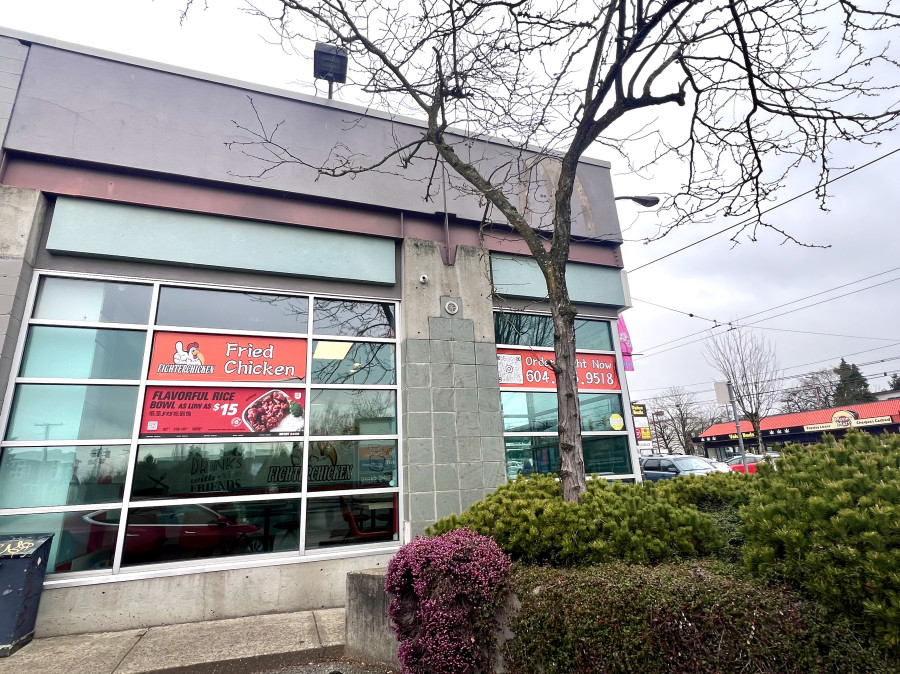
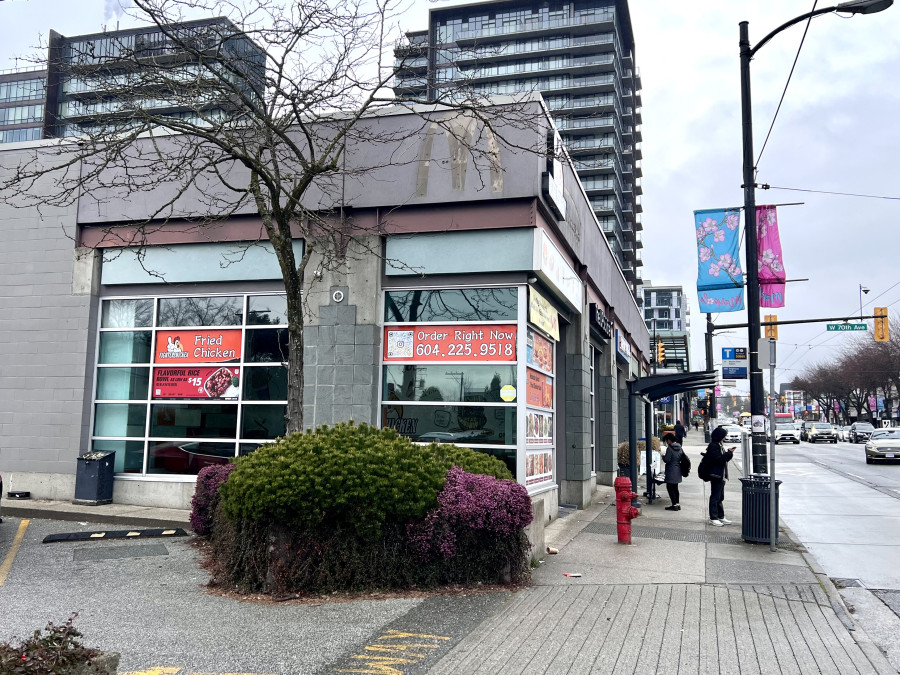
Marpole黄金地段知名炸鸡连锁店生意转让 (MLS#C8074557)
Marpole黄金地段知名炸鸡连锁店生意转让 (MLS#C8074557)
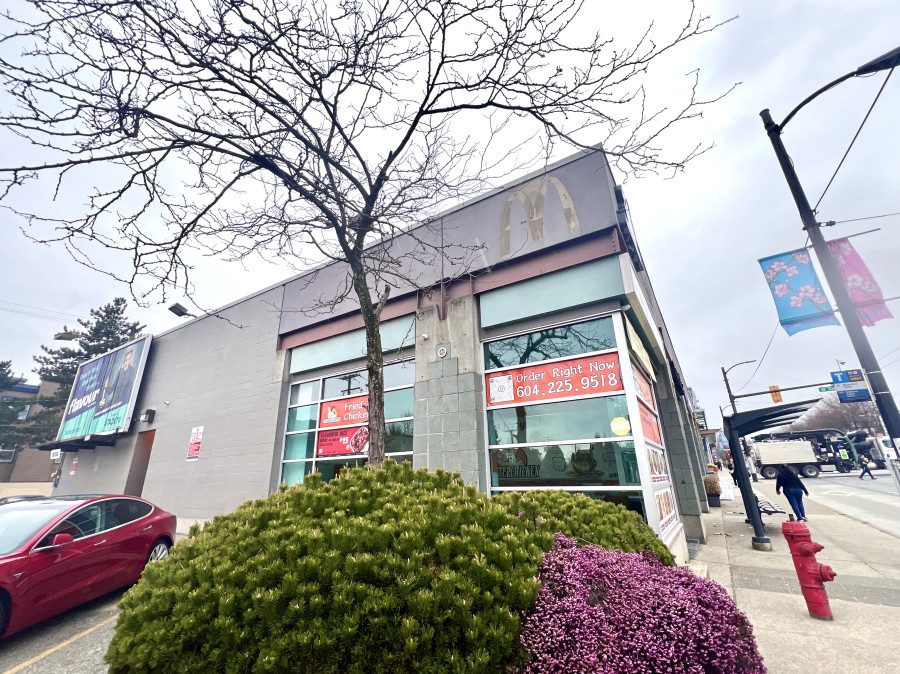
8631 Granville Street Vancouver, Vancouver, BC V6P 5A2 地图周边 | 社区结构

售价 (加元)
$198,000
年营业额
--
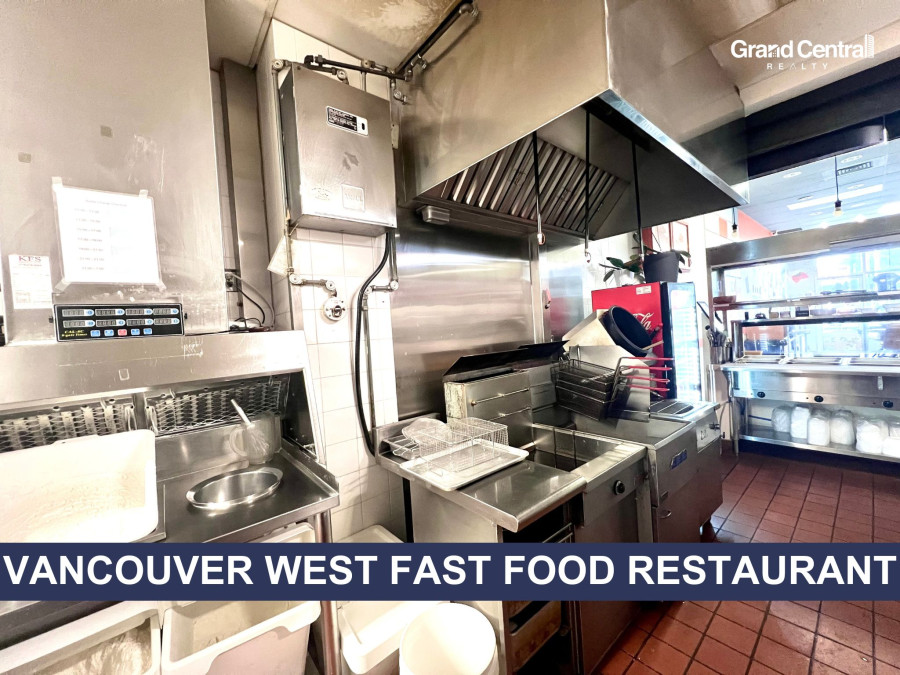
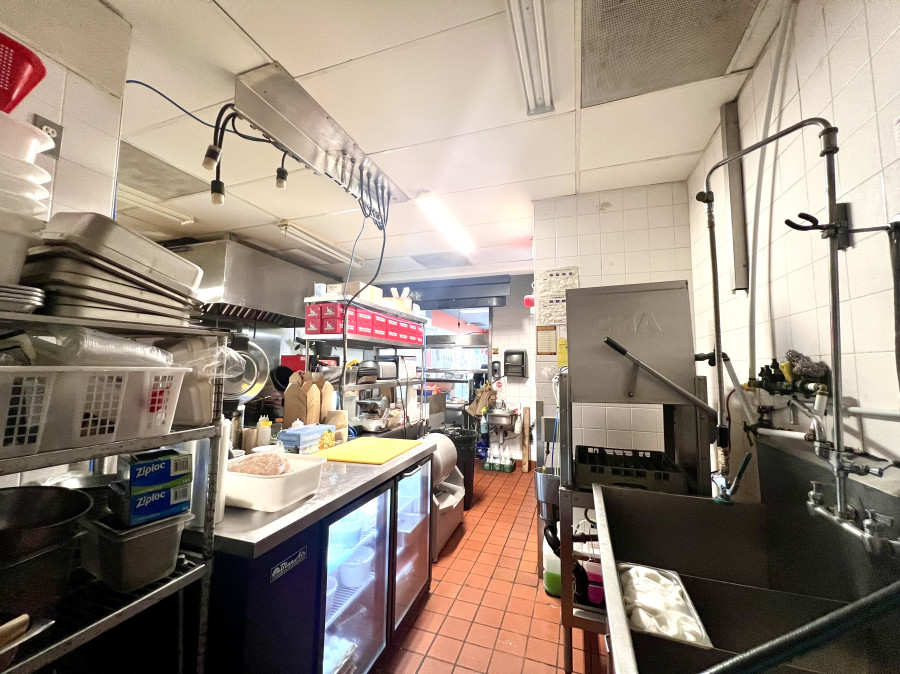
行业类型
餐饮业
- 餐馆
物件说明
- iU91编号 139315
- 发布人 地产经纪