
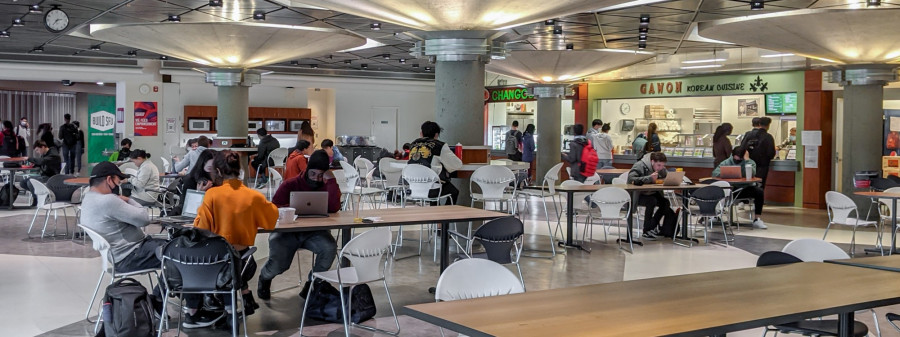
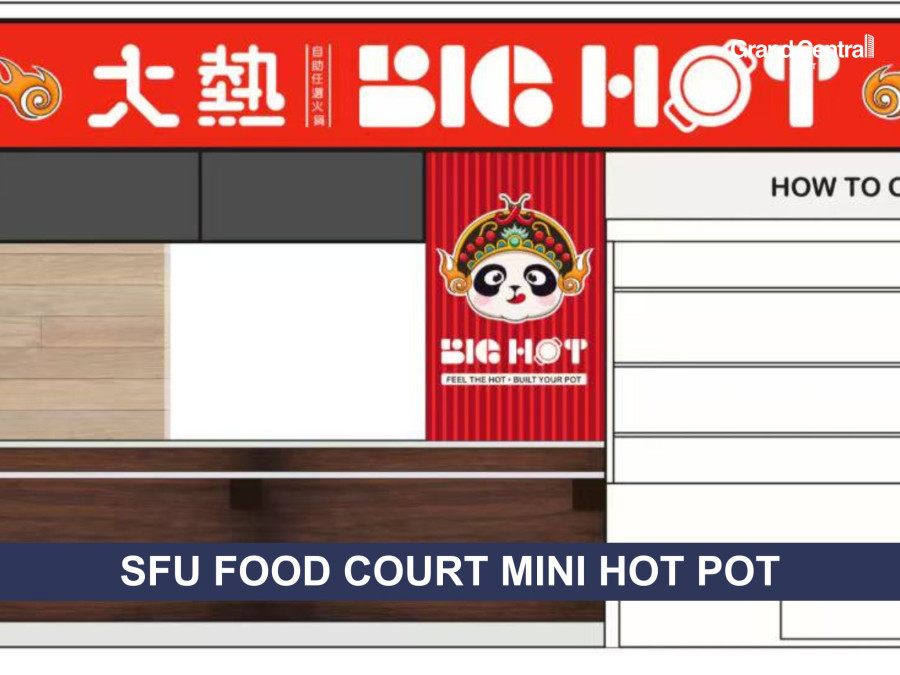
SFU Maggie Benston 美食广场生意(MLS#C8067054)
新盘
SFU Maggie Benston 美食广场生意(MLS#C8067054)
新盘
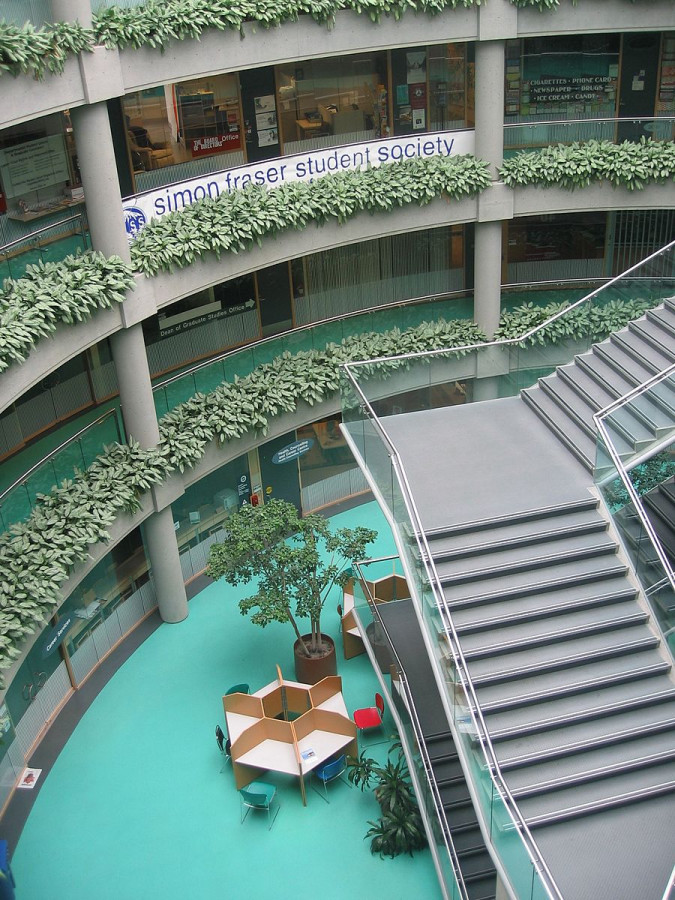
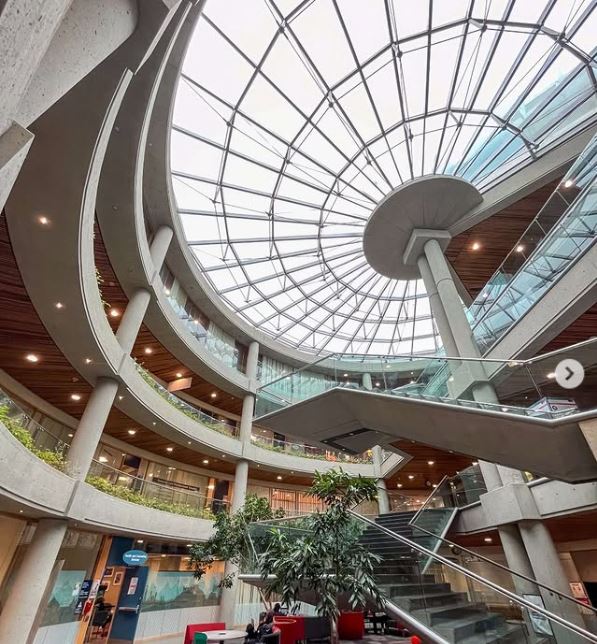
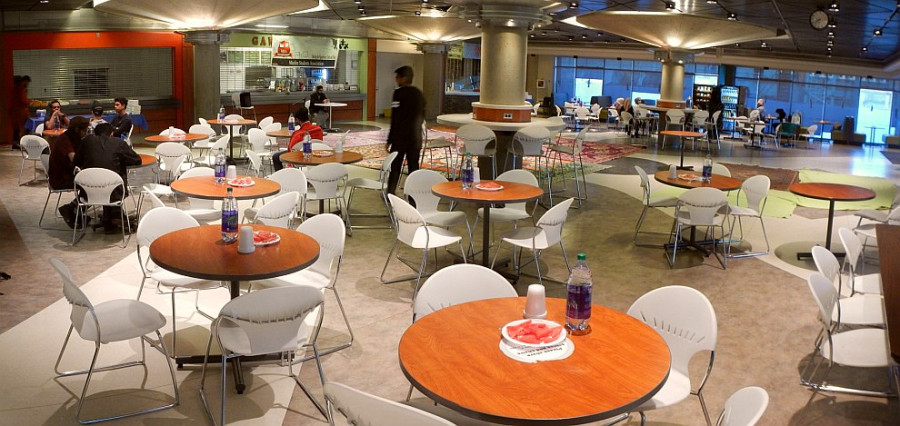
2301 - 8888 University Drive Burnaby, Burnaby, Vancouver, BC V5A 1S6 地图周边 | 社区结构

售价 (加元)
$398,000
年营业额
--
行业类型
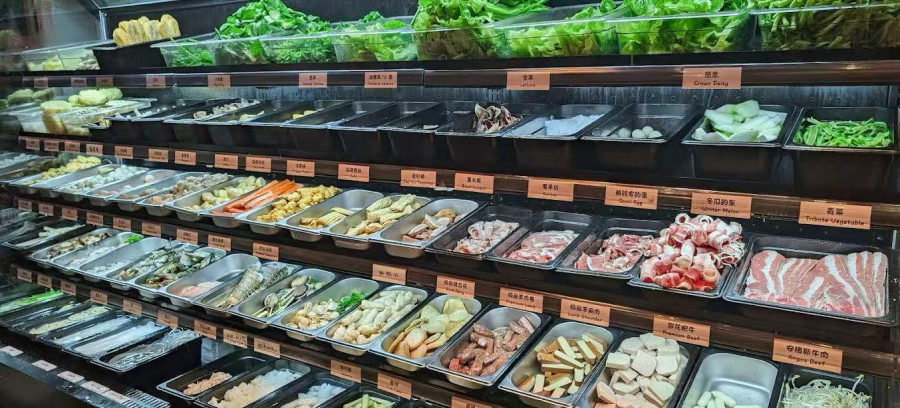
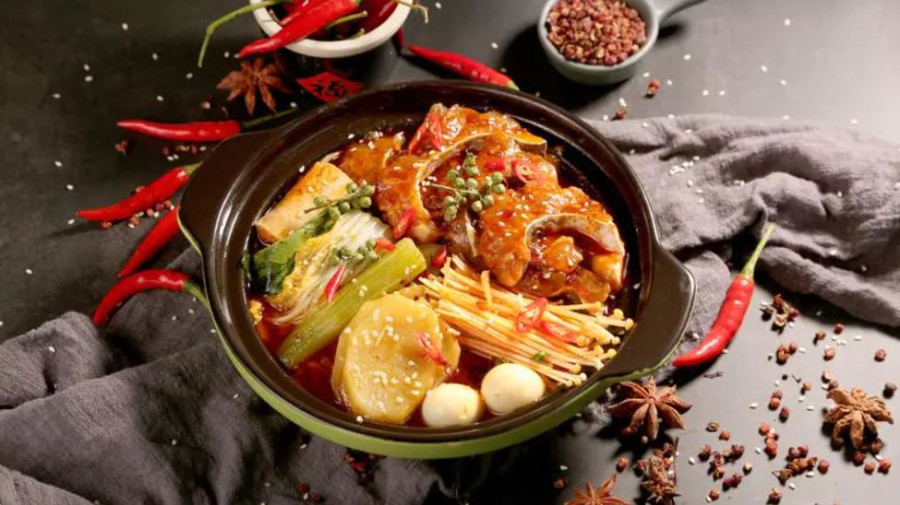
餐饮业
- 餐馆
物件说明
- iU91编号 139132
- 发布人 地产经纪